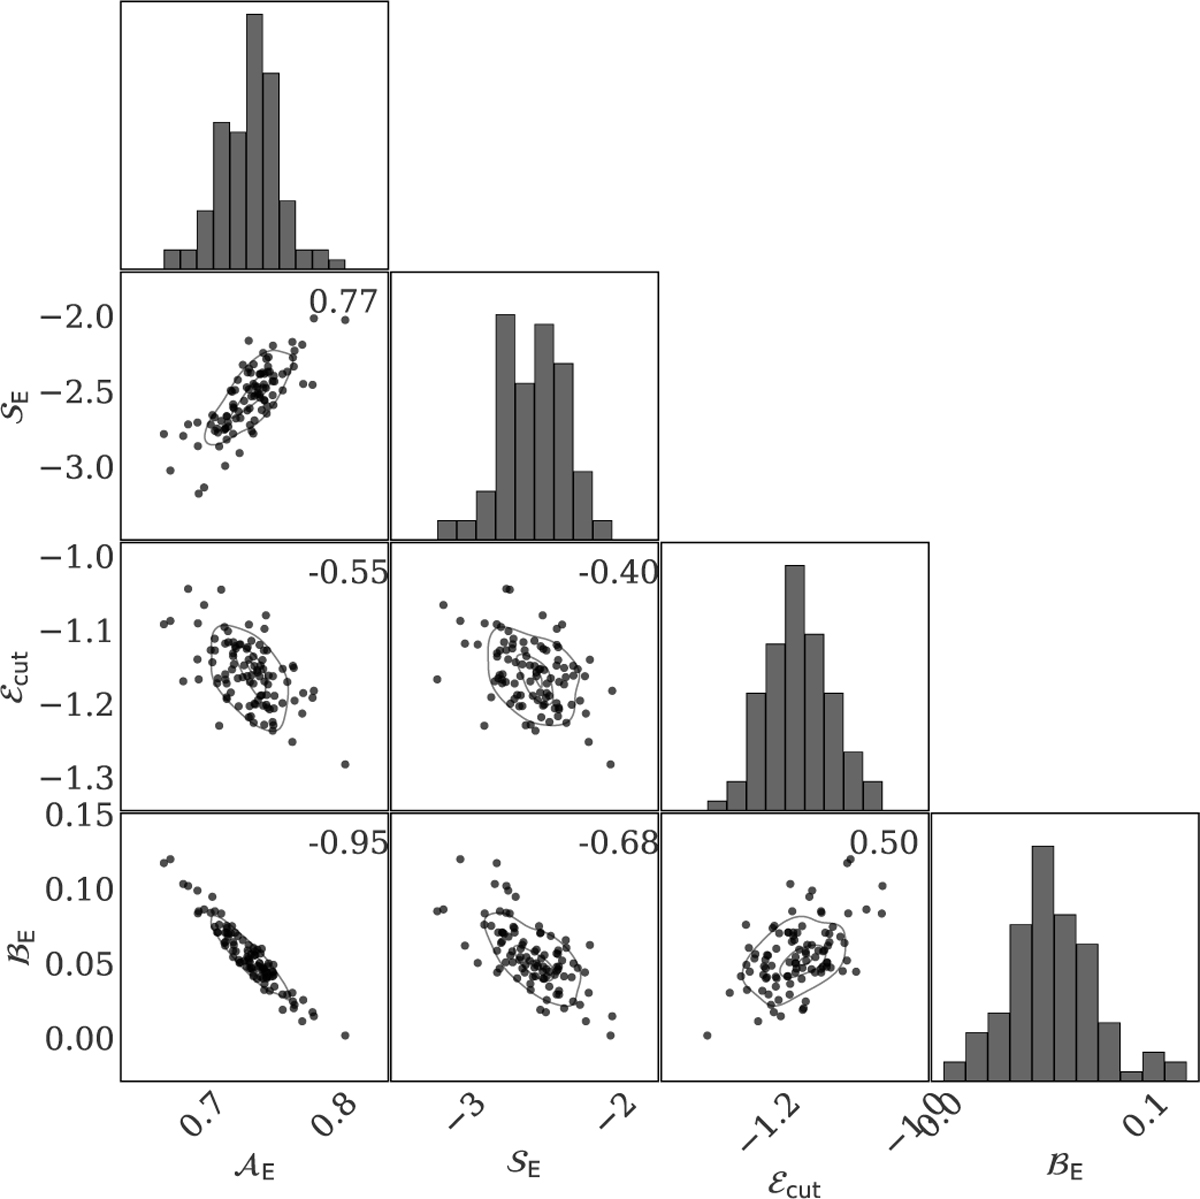
Fig. B.1
Download original image
Corner plots of the fitted parameters 𝒜E, 𝒮E, ℰcut, and ℬE. Contours in the scatter plots indicate the 39.3% (1σ), 86.5% (2σ), and 98.9% (3σ) confidence levels. Numbers in the upper right of each panel give the Pearson correlation coefficient between the corresponding parameters. (a) Parameters. (b) Parameters 𝒜P, 𝒮P, 𝒫cut, and ℬP. Each point corresponds to one simulation, not posterior samples.
Current usage metrics show cumulative count of Article Views (full-text article views including HTML views, PDF and ePub downloads, according to the available data) and Abstracts Views on Vision4Press platform.
Data correspond to usage on the plateform after 2015. The current usage metrics is available 48-96 hours after online publication and is updated daily on week days.
Initial download of the metrics may take a while.