Fig. 3
Download original image
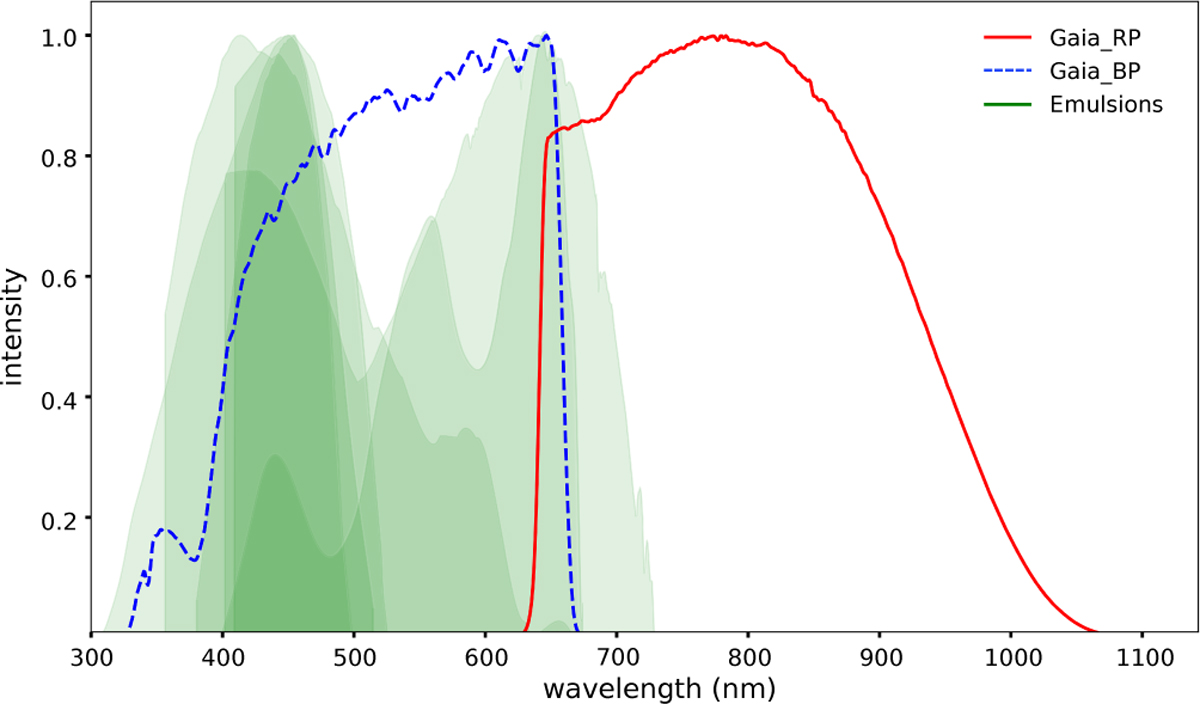
Spectral sensitivities of various pg and pv plates coated with different emulsions are shown relative to the Gaia photometric system. The green areas represent the plate’s emulsion color responses, which already include the atmospheric transmission data, using the air mass 1.5 to 0 ratio, while the dashed blue and solid red lines indicate Gaia’s blue and red photometer sensitivities, respectively.
Current usage metrics show cumulative count of Article Views (full-text article views including HTML views, PDF and ePub downloads, according to the available data) and Abstracts Views on Vision4Press platform.
Data correspond to usage on the plateform after 2015. The current usage metrics is available 48-96 hours after online publication and is updated daily on week days.
Initial download of the metrics may take a while.