Fig. 4
Download original image
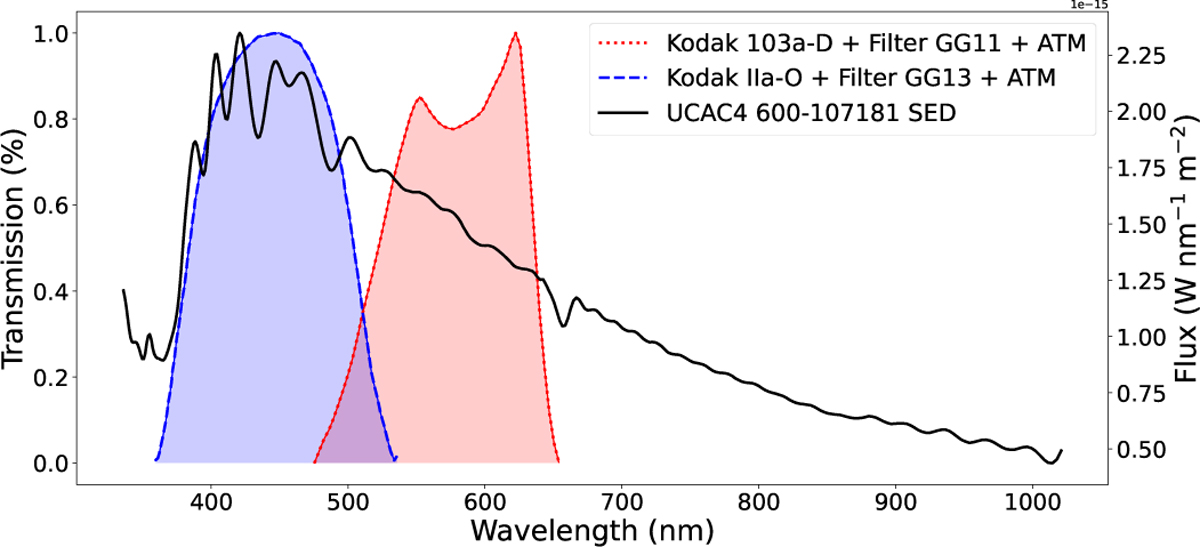
Low-resolution spectrum of UCAC4 600-107181 is compared with two spectral-sensitivity curves of Kodak emulsions with Schott filters for photographic photometry. The Gaia SED is shown with a solid black line (right axis). The blue-filled plot with the dashed line represents the spectral sensitivity of the Kodak IIa-O emulsion combined with the transmission of a 2 mm Schott GG13 (=385) filter, which closely matches the Johnson-Cousins B band (blue-sensitive plate). The red-filled plot with a dotted line illustrates Kodak 103a-D emulsion plus a 2 mm Schott GG11 filter, which closely matches the Johnson-Cousins V band (visible-light-sensitive plate). The influence of atmospheric transmission was taken into account for both spectral sensitivity curves at the zenith (air mass 1). All spectral curves here were normalized to their individual maximum.
Current usage metrics show cumulative count of Article Views (full-text article views including HTML views, PDF and ePub downloads, according to the available data) and Abstracts Views on Vision4Press platform.
Data correspond to usage on the plateform after 2015. The current usage metrics is available 48-96 hours after online publication and is updated daily on week days.
Initial download of the metrics may take a while.