Fig. 1
Download original image
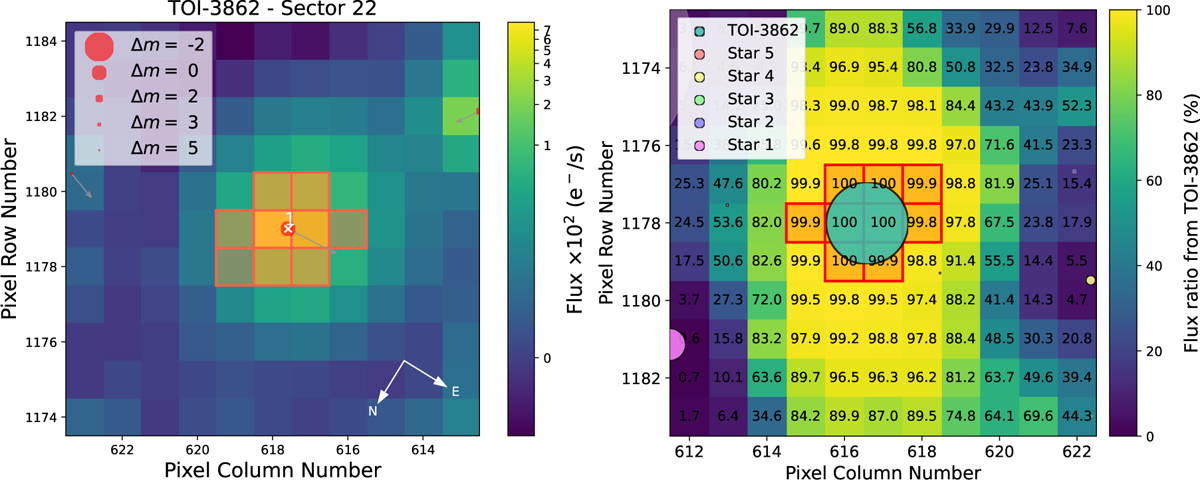
Left: TESS TPF of Sector 22 for TOI-3862. The color bar represents the electron counts for each pixel. The orange squares denote the pixels chosen by the TESS pipeline for aperture photometry. All sources from Gaia DR3 are overlaid on the plot and depicted as circles of varying sizes, corresponding to their G-mag difference relative to the target (as detailed in the legend). This visualization was generated using the tpfplotter code (Aller et al. 2020). Gray arrows indicate the proper motion directions for all sources shown in the plot. Right: TESS heat maps, generated through TESS-cont (Castro-González et al. 2024b), showing the percentage of the flux in each pixel that comes from the target star. The five most contaminating Gaia DR3 sources are overlaid with sizes scaling with their emitted fluxes.
Current usage metrics show cumulative count of Article Views (full-text article views including HTML views, PDF and ePub downloads, according to the available data) and Abstracts Views on Vision4Press platform.
Data correspond to usage on the plateform after 2015. The current usage metrics is available 48-96 hours after online publication and is updated daily on week days.
Initial download of the metrics may take a while.