Fig. 3
Download original image
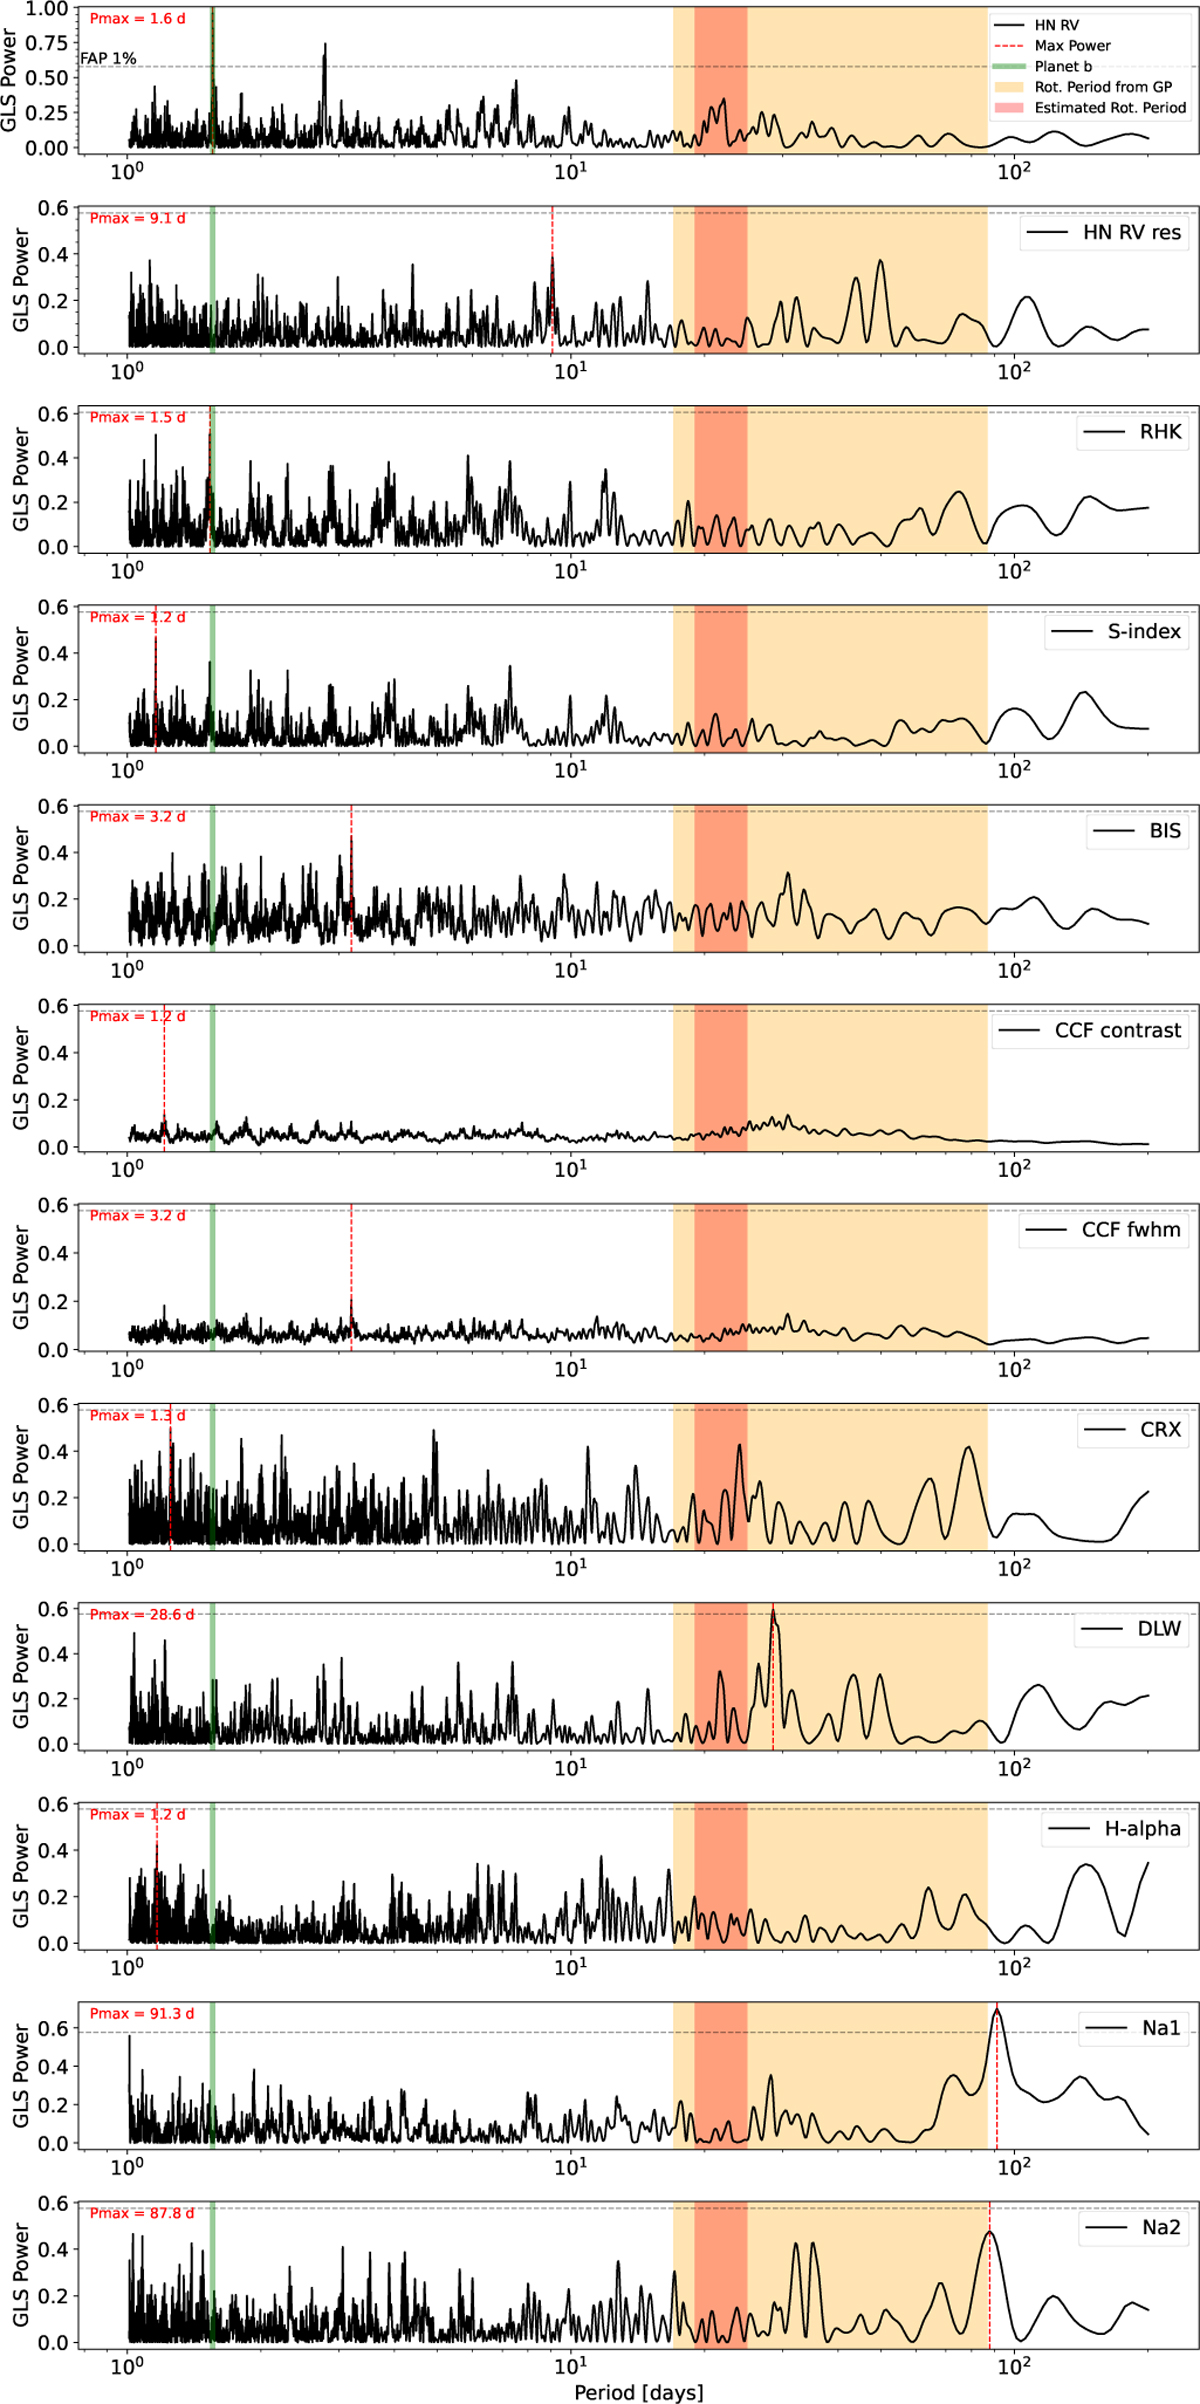
GLS periodograms for TOI-3862. The periodograms were performed for the RV dataset, its residuals (after subtracting the fit model), and all the activity indicators obtained through the HARPS-N DRS (![]() , S-index, Bisector, CCF Contrast, and CCF FWHM) and serval (chromospheric index CRX, dLw, H-alpha, and the sodium lines Na1 and Na2). The stellar rotation period, highlighted by the orange region in the periodograms, corresponds to the result of the joint fit using GPs with broad period boundaries (2–100 days), as described in Section 5. The red region indicates the rotation period estimated from the SED analysis (see Section 3.3). The dashed red line marks the period corresponding to the maximum power in the periodograms, while the green line denotes the orbital period of planets b.
, S-index, Bisector, CCF Contrast, and CCF FWHM) and serval (chromospheric index CRX, dLw, H-alpha, and the sodium lines Na1 and Na2). The stellar rotation period, highlighted by the orange region in the periodograms, corresponds to the result of the joint fit using GPs with broad period boundaries (2–100 days), as described in Section 5. The red region indicates the rotation period estimated from the SED analysis (see Section 3.3). The dashed red line marks the period corresponding to the maximum power in the periodograms, while the green line denotes the orbital period of planets b.
Current usage metrics show cumulative count of Article Views (full-text article views including HTML views, PDF and ePub downloads, according to the available data) and Abstracts Views on Vision4Press platform.
Data correspond to usage on the plateform after 2015. The current usage metrics is available 48-96 hours after online publication and is updated daily on week days.
Initial download of the metrics may take a while.