Fig. 6
Download original image
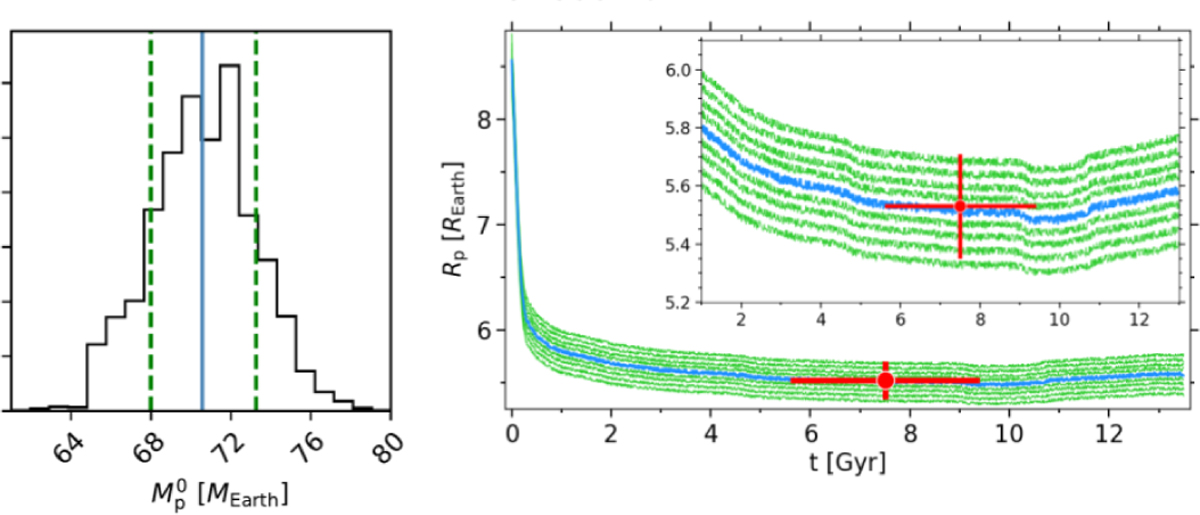
JADE simulations of atmospheric evolution for TOI-3862 b. Left: posterior distribution of the initial planet mass. The median is marked by a blue line; the 1σ HDI is shown as dashed green lines. Right: temporal evolution of the planet’s radius in the best-fit simulation (blue) and a representative set within the 1σ HDI (green). The red point indicates the measured age and radius, with associated uncertainties. An inset shows a zoomed-in view of the planet radius over a narrower range.
Current usage metrics show cumulative count of Article Views (full-text article views including HTML views, PDF and ePub downloads, according to the available data) and Abstracts Views on Vision4Press platform.
Data correspond to usage on the plateform after 2015. The current usage metrics is available 48-96 hours after online publication and is updated daily on week days.
Initial download of the metrics may take a while.