Open Access
Fig. 5.
Download original image
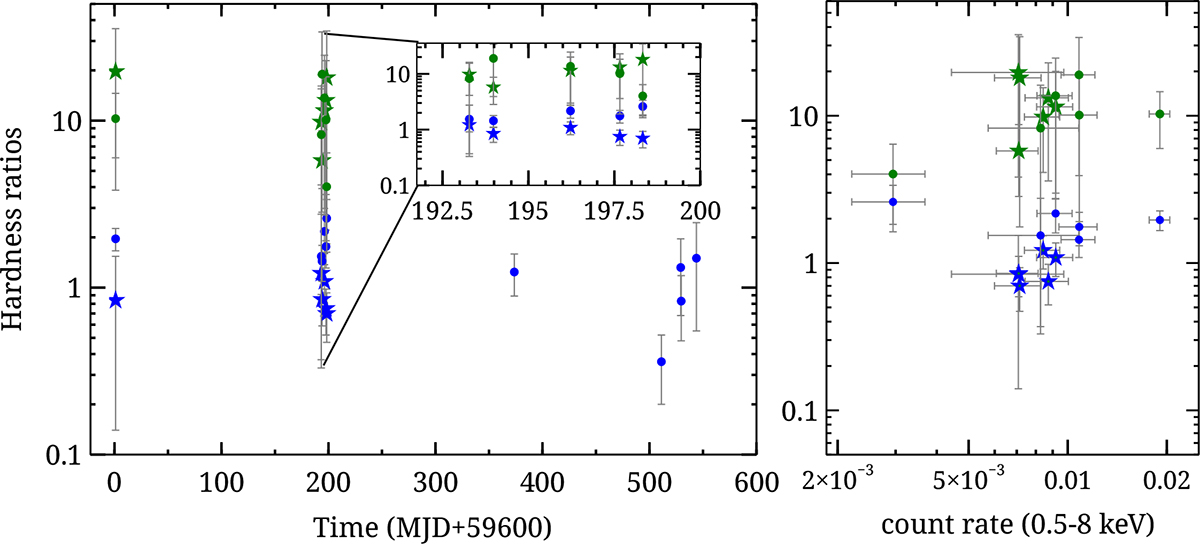
Left panel: Hardness ratios versus time. Right panel: Hardness–intensity diagram of ULXs X–6 and X–7. X–6 and X–7 are represented by filled circles and stars, respectively. Green and blue colors show the medium/soft and hard/medium ratios, respectively. All error bars represent the 1σ level.
Current usage metrics show cumulative count of Article Views (full-text article views including HTML views, PDF and ePub downloads, according to the available data) and Abstracts Views on Vision4Press platform.
Data correspond to usage on the plateform after 2015. The current usage metrics is available 48-96 hours after online publication and is updated daily on week days.
Initial download of the metrics may take a while.