Fig. 6.
Download original image
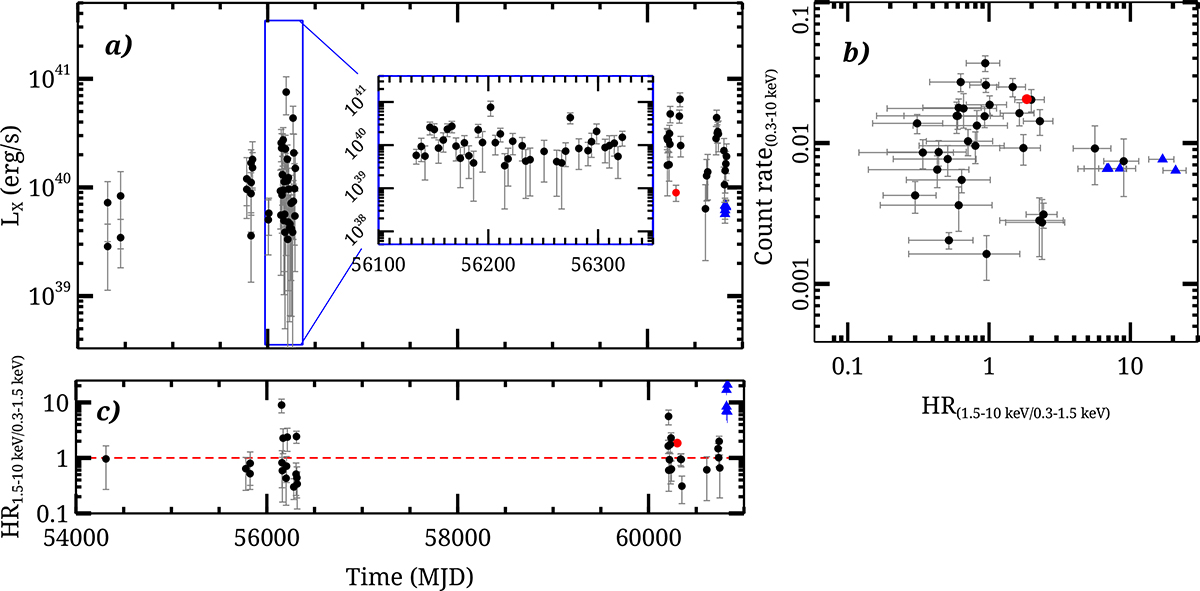
Long-term X-ray properties of ULX-3. (a) LX light curve in the 0.3–10 keV band, with the inset showing a zoomed-in view for clarity (MJD 56134-56322). (b) Hardness–intensity diagram, where the count rate in the 0.3–10 keV band is plotted against the hardness ratio HR1.5 − 10 keV/0.3 − 1.5 keV. (c) Temporal evolution of the hardness ratio HR3.5 − 10 keV/2 − 3.5 keV as a function of time (MJD), with the dashed red line marking the reference level. Swift/XRT, XMM-Newton, and Chandra observations are shown with filled black and red circles and blue triangles, respectively.
Current usage metrics show cumulative count of Article Views (full-text article views including HTML views, PDF and ePub downloads, according to the available data) and Abstracts Views on Vision4Press platform.
Data correspond to usage on the plateform after 2015. The current usage metrics is available 48-96 hours after online publication and is updated daily on week days.
Initial download of the metrics may take a while.