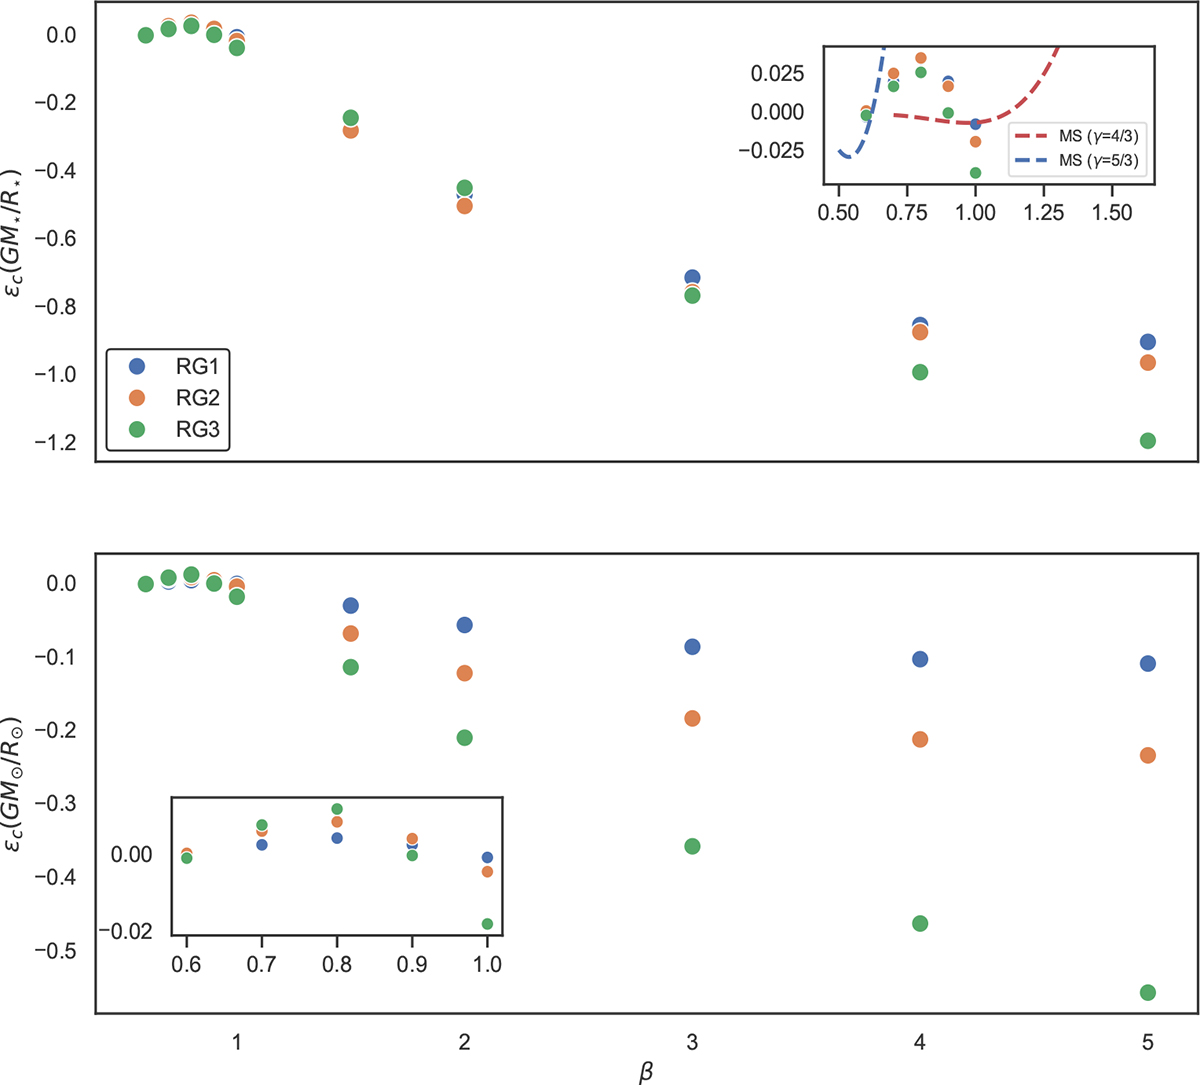
Fig. 2.
Download original image
Final specific orbital energy (ϵc) with different β. The upper and lower panel correspond to ϵc normalized to GM★/R★ and G M⊙/R⊙, respectively. The zoomed-in insets show the results of β ≲ 1. In the inset in the upper panel, the dashed red and blue lines represent main-sequence star (MS) disruptions for the γ = 5/3 and γ = 4/3 cases studied by Chen et al. (2024), respectively (see the main text for details).
Current usage metrics show cumulative count of Article Views (full-text article views including HTML views, PDF and ePub downloads, according to the available data) and Abstracts Views on Vision4Press platform.
Data correspond to usage on the plateform after 2015. The current usage metrics is available 48-96 hours after online publication and is updated daily on week days.
Initial download of the metrics may take a while.