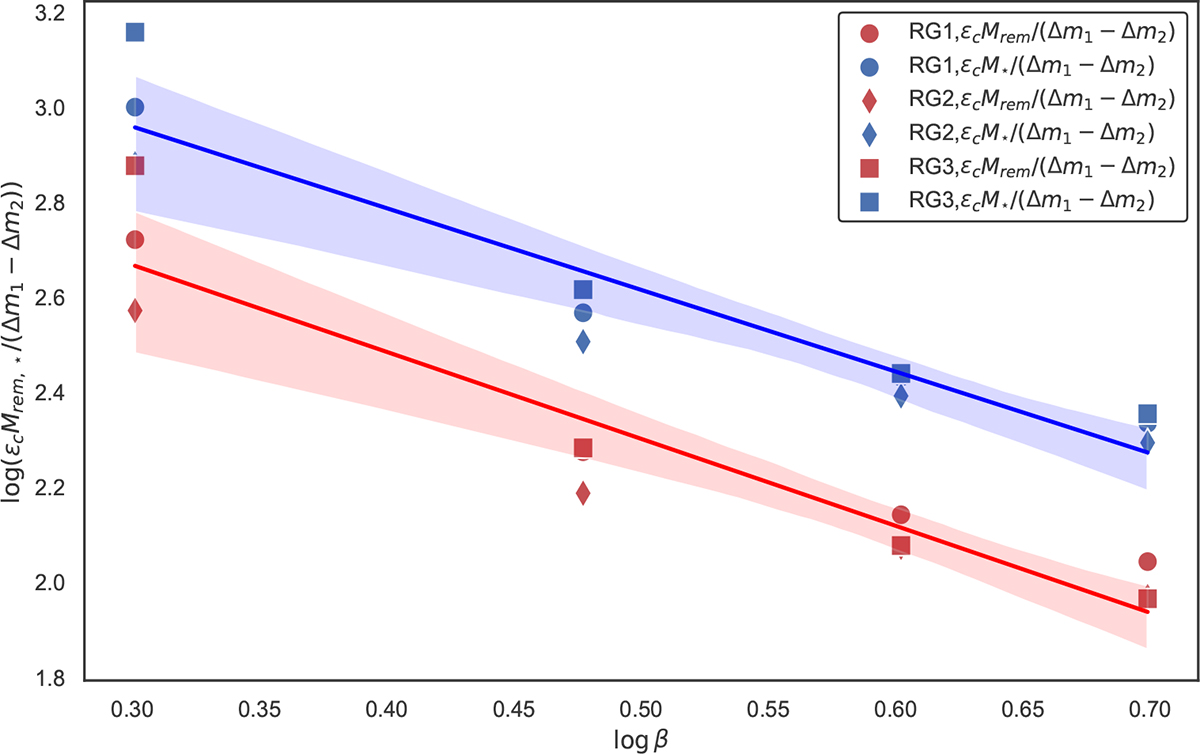
Fig. 5.
Download original image
Dependence of ϵcM★, rem/(Δm1 − Δm2) on β in our simulations, where ϵc is normalized to GM★/R★. The solid blue line and shaded region represent the best-fit linear relationship between ϵcM★/(Δm1 − Δm2) and β in logarithmic coordinates and the corresponding 95% confidence interval, respectively. The solid red line and shaded region show the equivalent relationship for ϵcMrem/(Δm1 − Δm2).
Current usage metrics show cumulative count of Article Views (full-text article views including HTML views, PDF and ePub downloads, according to the available data) and Abstracts Views on Vision4Press platform.
Data correspond to usage on the plateform after 2015. The current usage metrics is available 48-96 hours after online publication and is updated daily on week days.
Initial download of the metrics may take a while.