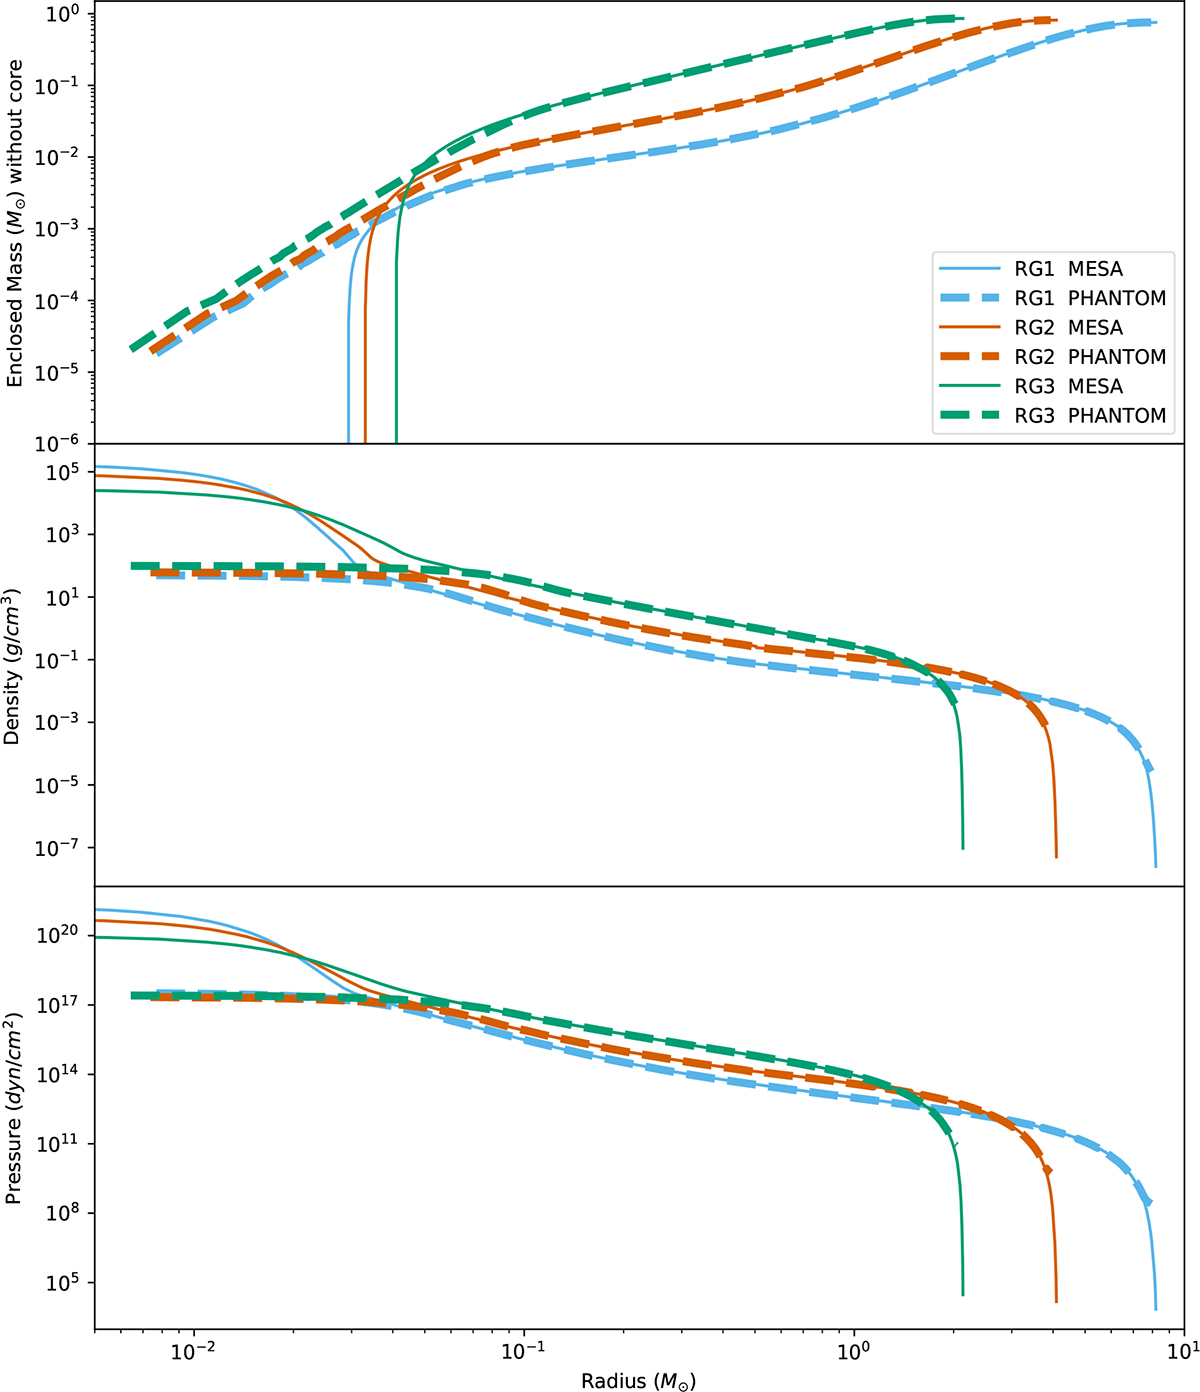
Fig. B.1.
Download original image
Comparison of the stellar structure of the giant stars in MESA and the relaxed star in PHANTOM. The upper, middle, and lower panels represent the enclosed mass, density, and pressure at different radii, respectively. Blue, red, and green lines represent RG1, RG2, and RG3, respectively. Dashed and solid lines indicate stars in MESA and PHANTOM, respectively. Since the core is replaced by a sink particle, there is a difference at low radius.
Current usage metrics show cumulative count of Article Views (full-text article views including HTML views, PDF and ePub downloads, according to the available data) and Abstracts Views on Vision4Press platform.
Data correspond to usage on the plateform after 2015. The current usage metrics is available 48-96 hours after online publication and is updated daily on week days.
Initial download of the metrics may take a while.