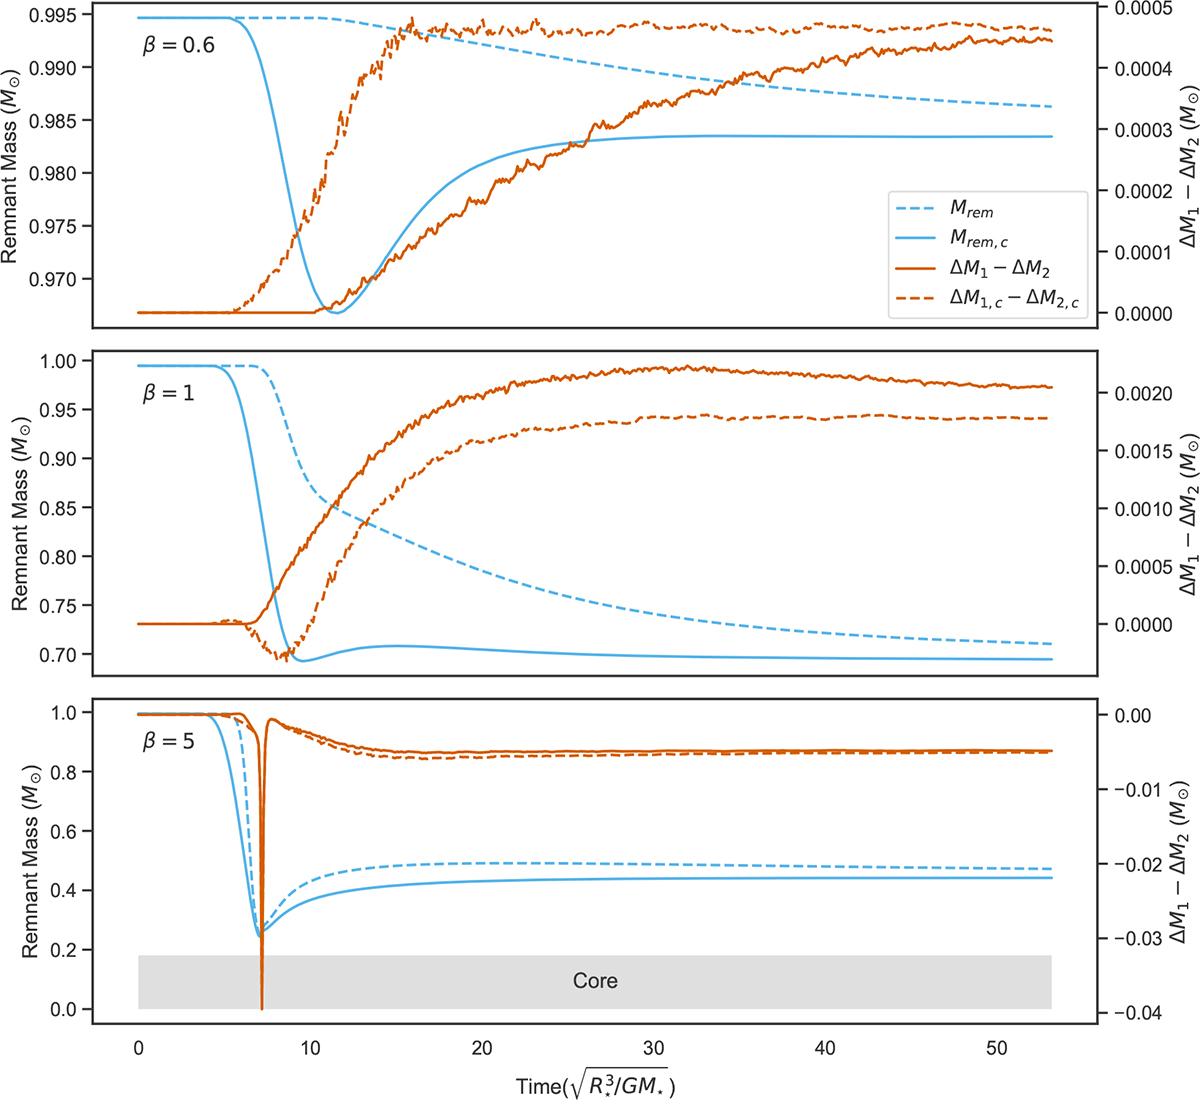
Fig. C.1.
Download original image
Comparison of the mass loss calculated via two different methods in our simulations. The top, middle, and bottom panels show the simulations of RG2 at β = 0.6, 1, and 5, respectively. The solid and dashed lines represent the two different definitions of the Hill radius from Eqs. C.1 and C.2. The gray area in the lower panel shows the dense core.
Current usage metrics show cumulative count of Article Views (full-text article views including HTML views, PDF and ePub downloads, according to the available data) and Abstracts Views on Vision4Press platform.
Data correspond to usage on the plateform after 2015. The current usage metrics is available 48-96 hours after online publication and is updated daily on week days.
Initial download of the metrics may take a while.