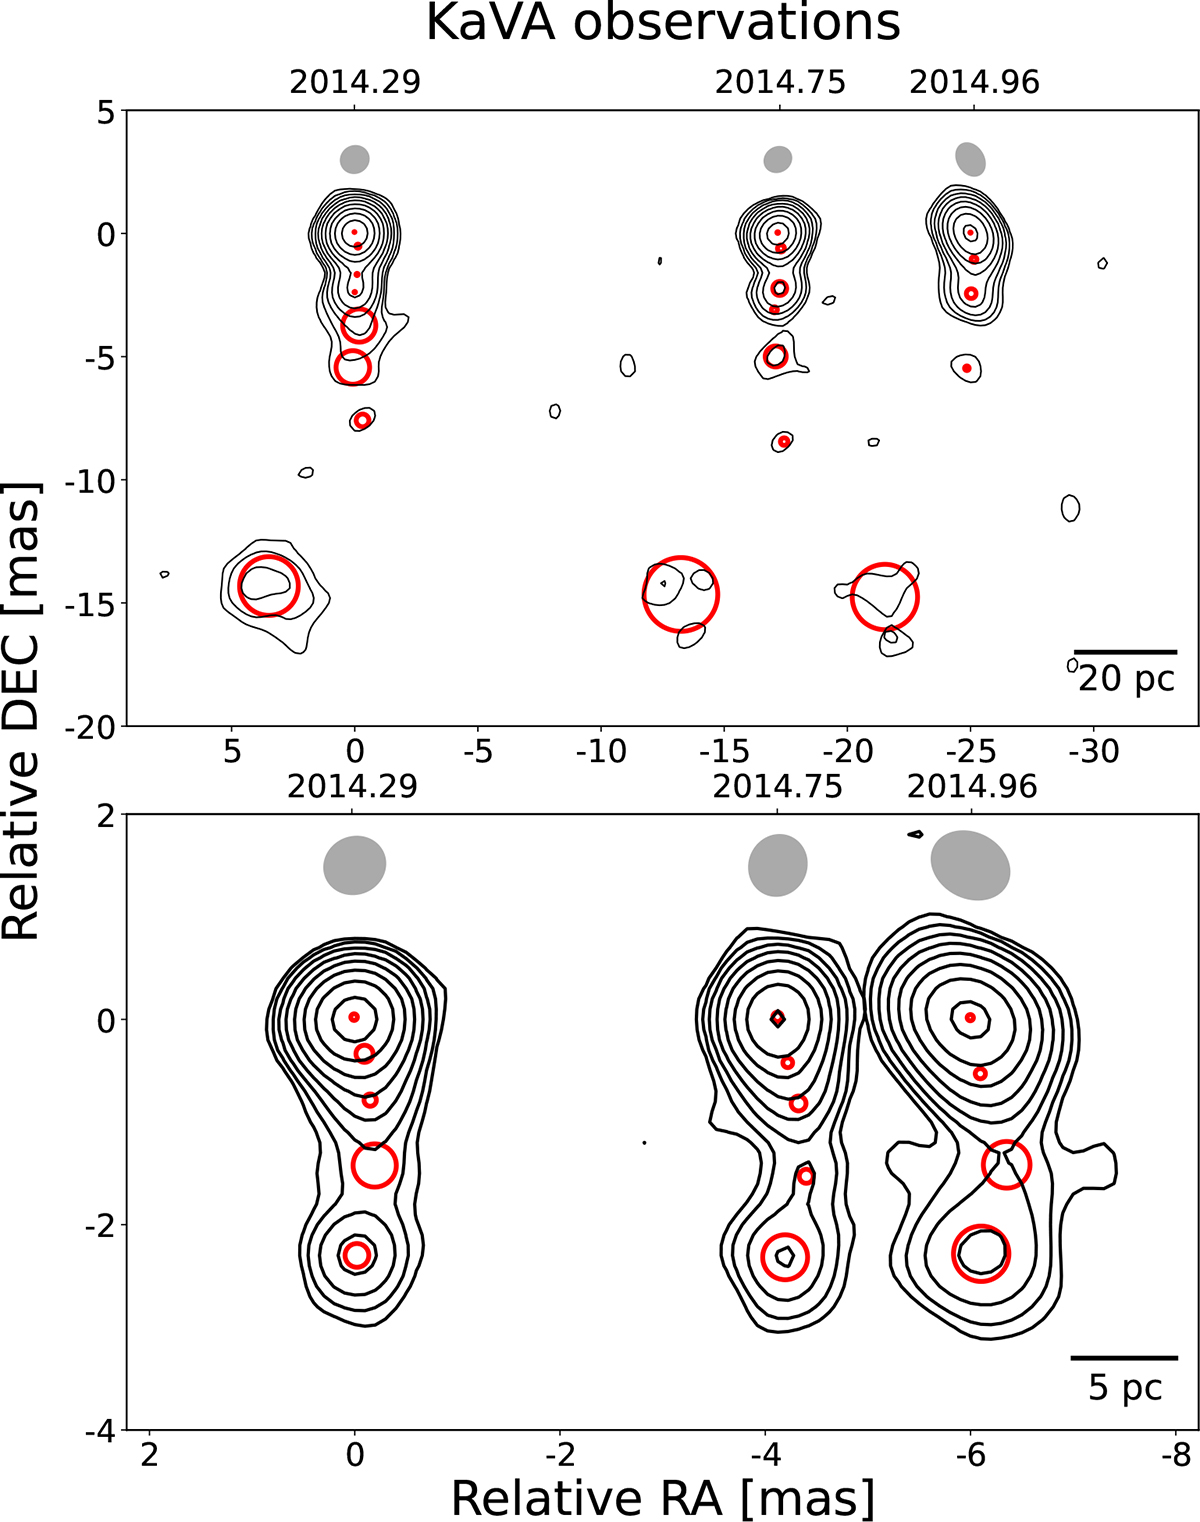
Fig. 1.
Download original image
KaVA intensity maps of the 3C 66A radio jet at 22 GHz (top) and 43 GHz (bottom) in 2014. The black contour levels start at three times the rms value, scaling twice. The grey shaded ellipses above each contour show the restoring beam. The detailed imaging parameters are summarized in Table E.1. The horizontal spacing is proportional to the observation time gap. The exact observing time is in the unit of years. The red circles are the model components obtained from modelfit. The continuous curved jet extends downwards to ∼3 mas on both panels.
Current usage metrics show cumulative count of Article Views (full-text article views including HTML views, PDF and ePub downloads, according to the available data) and Abstracts Views on Vision4Press platform.
Data correspond to usage on the plateform after 2015. The current usage metrics is available 48-96 hours after online publication and is updated daily on week days.
Initial download of the metrics may take a while.