Fig. A.3.
Download original image
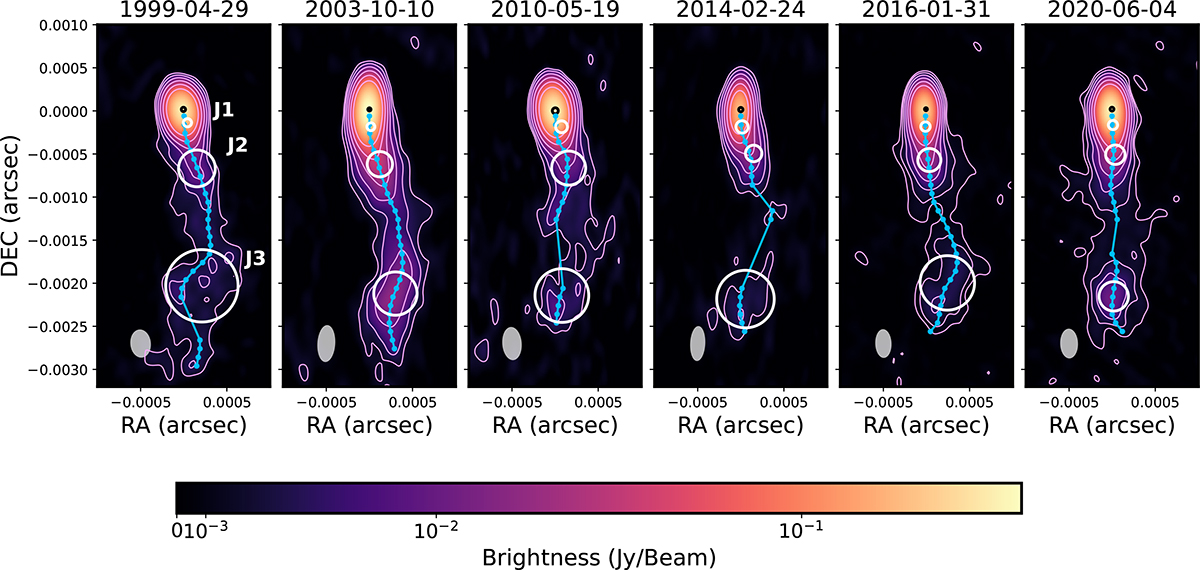
VLBA intensity maps at 43 GHz overplotted with three Gaussian fitted jet components (white) and core (black) at six epochs. In the leftmost panel, the labels J1, J2 and J3 denote the three jet components. The blue connected dots indicate the jet ridgeline. The pink contour levels start at three times the rms value, scaling twice. The gray ellipse at the bottom of each panel corresponds to the restoring beam.
Current usage metrics show cumulative count of Article Views (full-text article views including HTML views, PDF and ePub downloads, according to the available data) and Abstracts Views on Vision4Press platform.
Data correspond to usage on the plateform after 2015. The current usage metrics is available 48-96 hours after online publication and is updated daily on week days.
Initial download of the metrics may take a while.