Open Access
Fig. B.1.
Download original image
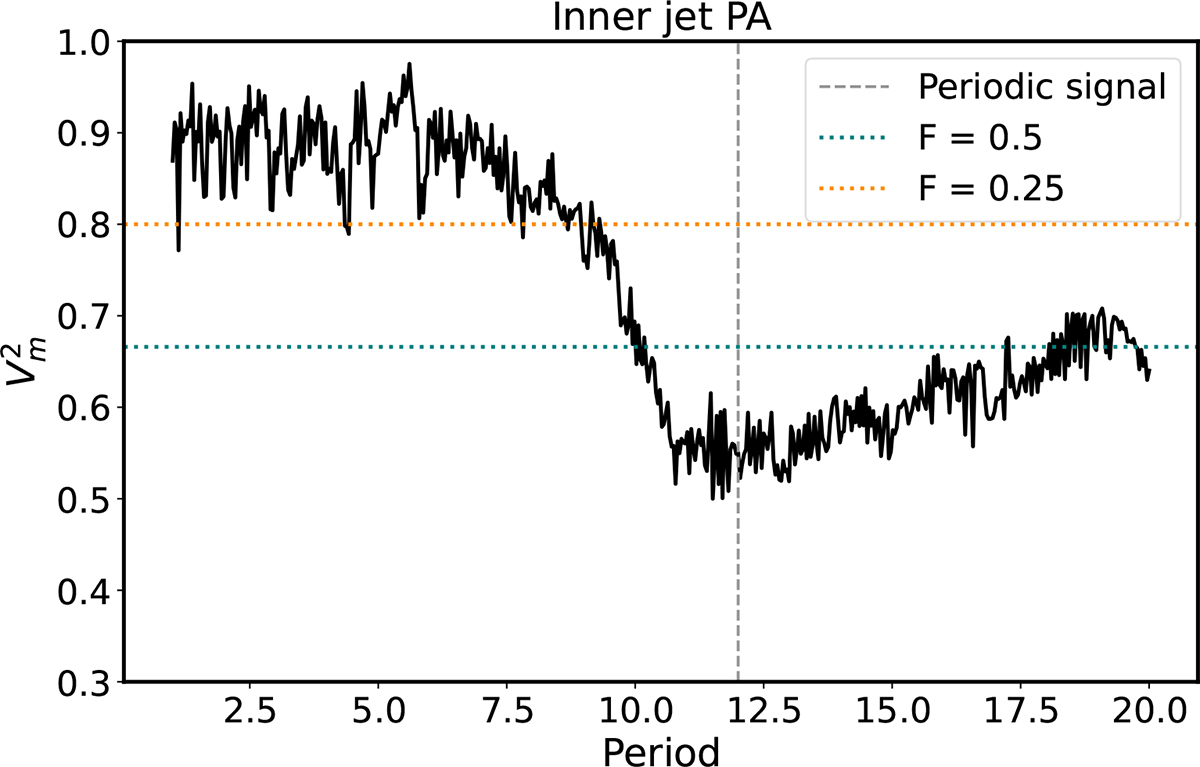
Jurkevic test plot for the inner jet PA. The black line corresponds to the Vm2 values whose minima indicate possible periodicities and the dotted blue (orange) line to the level F = 0.5 (F = 0.25). The vertical gray dashed line indicates the period at the minimum.
Current usage metrics show cumulative count of Article Views (full-text article views including HTML views, PDF and ePub downloads, according to the available data) and Abstracts Views on Vision4Press platform.
Data correspond to usage on the plateform after 2015. The current usage metrics is available 48-96 hours after online publication and is updated daily on week days.
Initial download of the metrics may take a while.