Open Access
Fig. 3.
Download original image
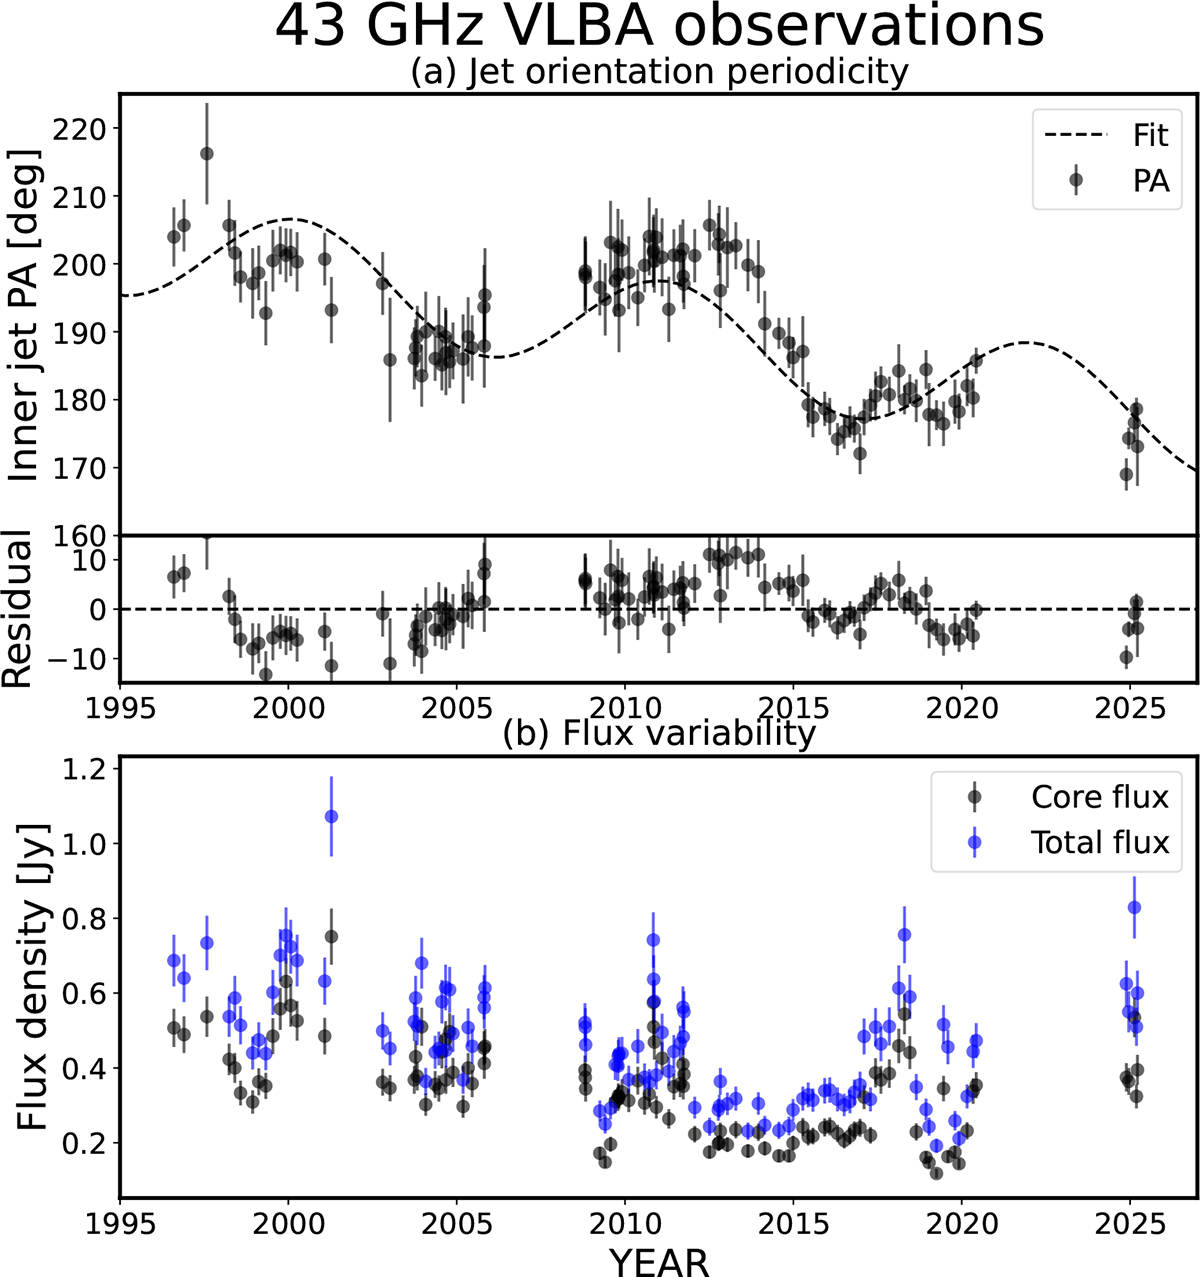
(a) Inner jet PA versus time at 43 GHz. The dashed curve in the upper panel is the analytic sinusoidal+linear fit. The lower panel shows the residuals. The fitting parameters are summarized in Table 1. (b) Time evolution of the total (blue) and core (black) flux density.
Current usage metrics show cumulative count of Article Views (full-text article views including HTML views, PDF and ePub downloads, according to the available data) and Abstracts Views on Vision4Press platform.
Data correspond to usage on the plateform after 2015. The current usage metrics is available 48-96 hours after online publication and is updated daily on week days.
Initial download of the metrics may take a while.