Fig. 7.
Download original image
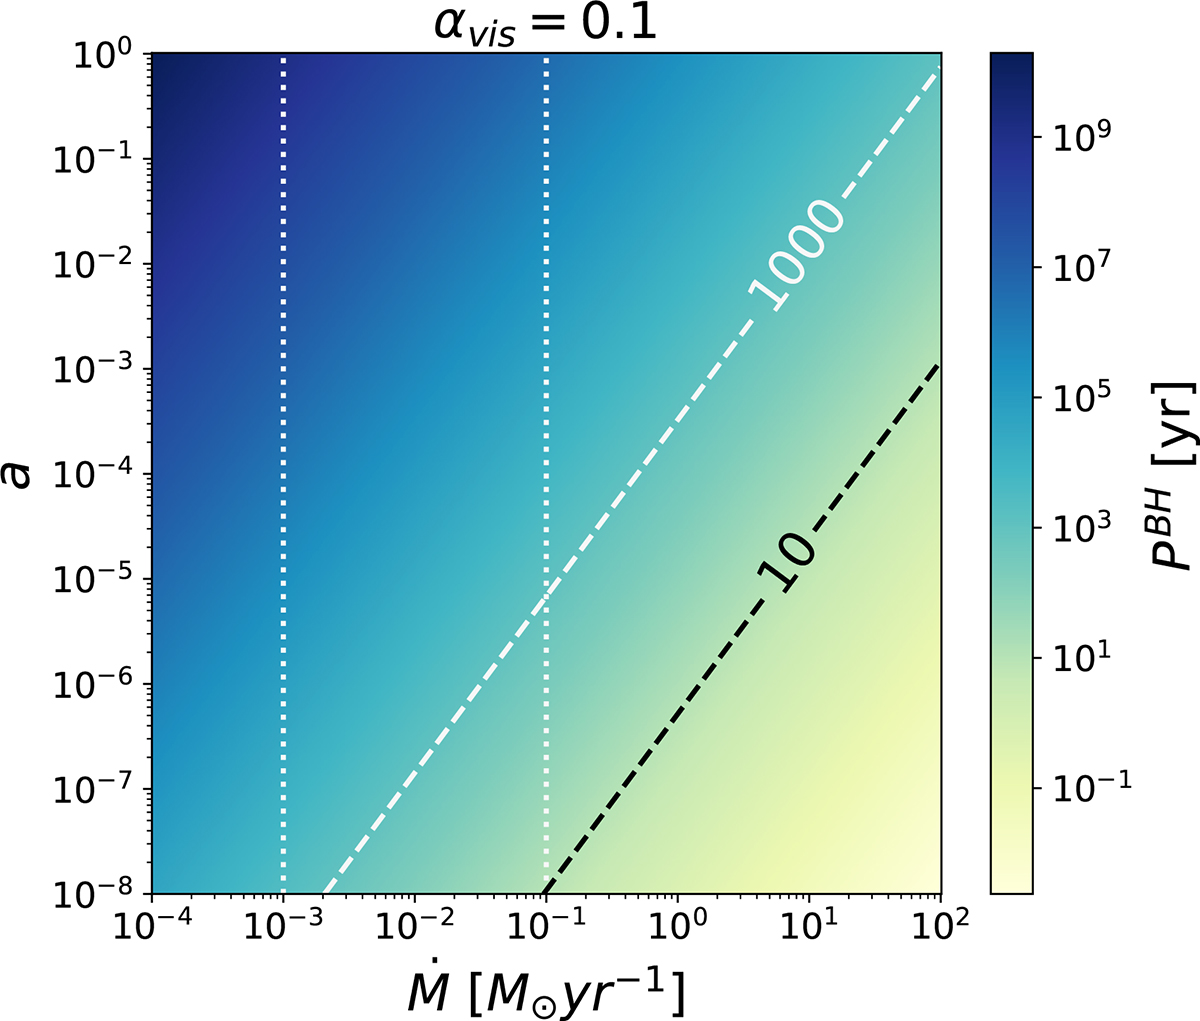
2D plot of the BH spin axis precession period as a function of the spin parameter a and the accretion rate Ṁ for αvis = 0.1. The black dashed line corresponds to PBH = 10 years and the gray one to PBH = 1000 years. The area in between the vertical dotted white lines corresponds to the typical range of accretion rates for BL Lac objects.
Current usage metrics show cumulative count of Article Views (full-text article views including HTML views, PDF and ePub downloads, according to the available data) and Abstracts Views on Vision4Press platform.
Data correspond to usage on the plateform after 2015. The current usage metrics is available 48-96 hours after online publication and is updated daily on week days.
Initial download of the metrics may take a while.