Open Access
Fig. A.1.
Download original image
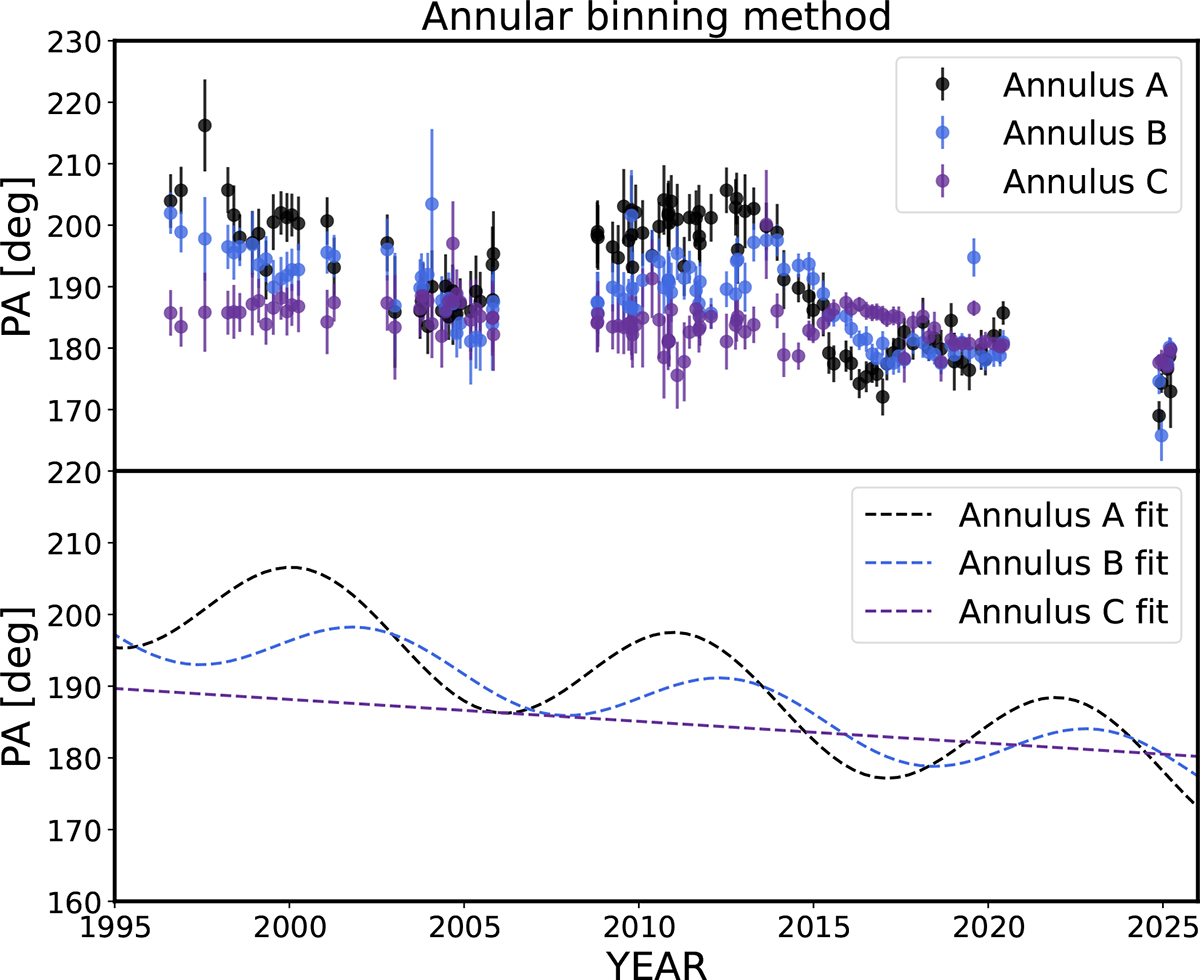
Evolution of the PA for the annuli A (inner jet: black), B (downstream jet: blue), and C (purple) at 43 GHz, obtained with the annular bin method. The data is shown in the upper panel and the analytical fits in the lower panel: sinusoidal+linear fits for the annuli A and B and linear fit for the annulus C.
Current usage metrics show cumulative count of Article Views (full-text article views including HTML views, PDF and ePub downloads, according to the available data) and Abstracts Views on Vision4Press platform.
Data correspond to usage on the plateform after 2015. The current usage metrics is available 48-96 hours after online publication and is updated daily on week days.
Initial download of the metrics may take a while.