Fig. 5
Download original image
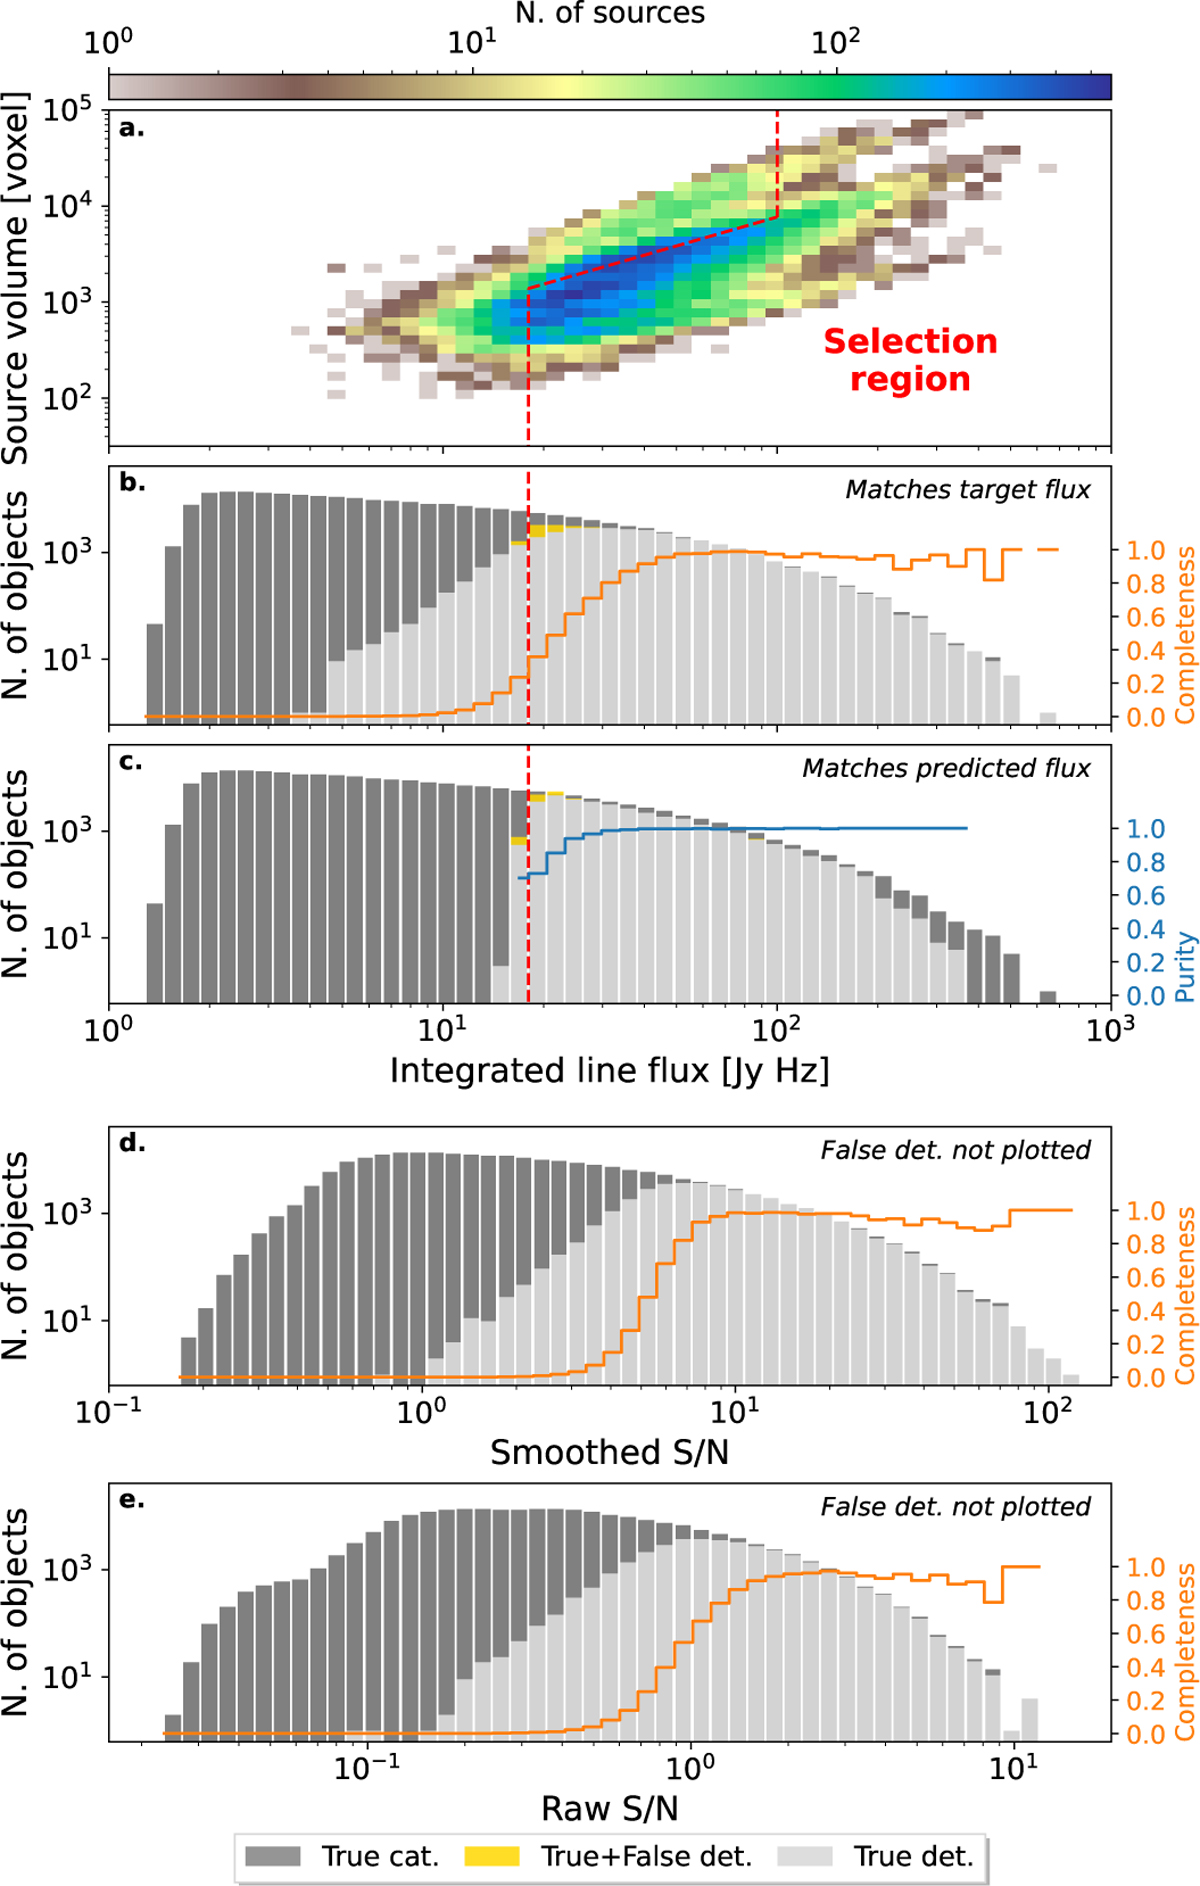
(a) Two-dimensional histogram of the MAIN cube detection matches target volume as a function of their target integrated line flux. The dashed red line represents the selection function as in Fig. 2. (b) Histogram of the target line flux for the MAIN truth catalog and the matched sources. False positives are added based on their predicted flux. Completeness is overplotted for relevant bins. (c) Histogram of the predicted line flux for the matched predicted sources and false positives. The MAIN truth catalog is plotted in the background based on the target line flux. Purity is overplotted for relevant bins. (d) Histogram of the smoothed S/N for the MAIN truth catalog and the matched sources. Completeness is overplotted for relevant bins. (e) Identical to d but using the raw non-smoothed S/N.
Current usage metrics show cumulative count of Article Views (full-text article views including HTML views, PDF and ePub downloads, according to the available data) and Abstracts Views on Vision4Press platform.
Data correspond to usage on the plateform after 2015. The current usage metrics is available 48-96 hours after online publication and is updated daily on week days.
Initial download of the metrics may take a while.