Fig. 6
Download original image
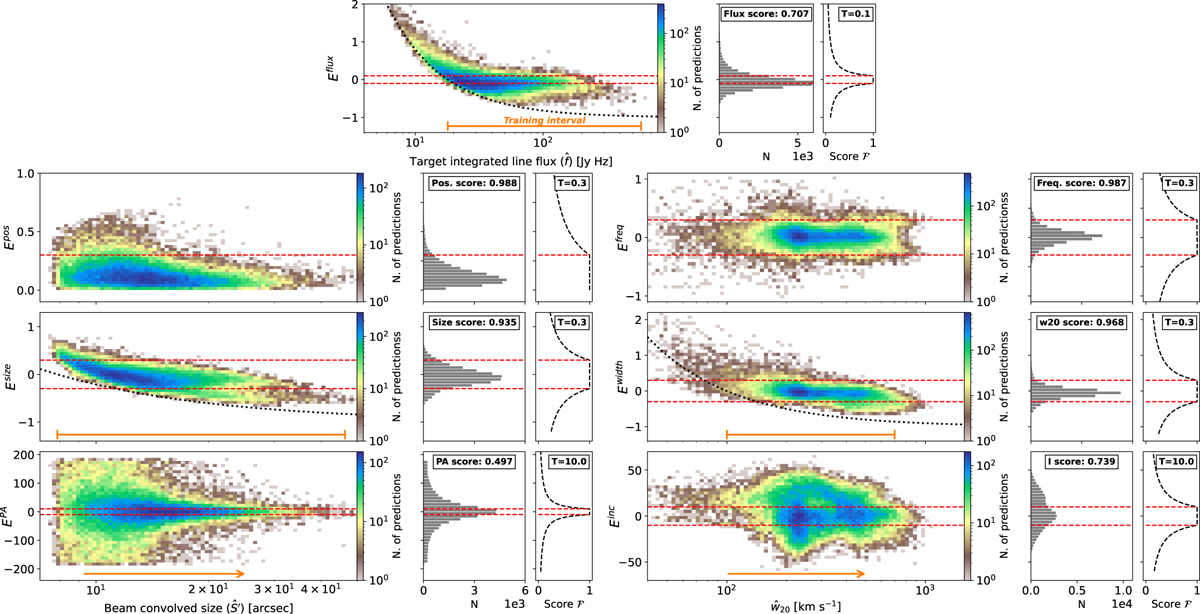
Subpart error distributions as 2D histograms against relevant target quantities or scales. For each subpart, the corresponding 1D error histogram and the associated score response functions are provided. The dashed red lines indicate the error region where the score saturates at 1. Orange lines and arrows indicate the range of values from the training sample when relevant. Dotted black lines represent the error obtained when predicting the minimum value from the training sample across the full comparison scale.
Current usage metrics show cumulative count of Article Views (full-text article views including HTML views, PDF and ePub downloads, according to the available data) and Abstracts Views on Vision4Press platform.
Data correspond to usage on the plateform after 2015. The current usage metrics is available 48-96 hours after online publication and is updated daily on week days.
Initial download of the metrics may take a while.