Fig. A.1
Download original image
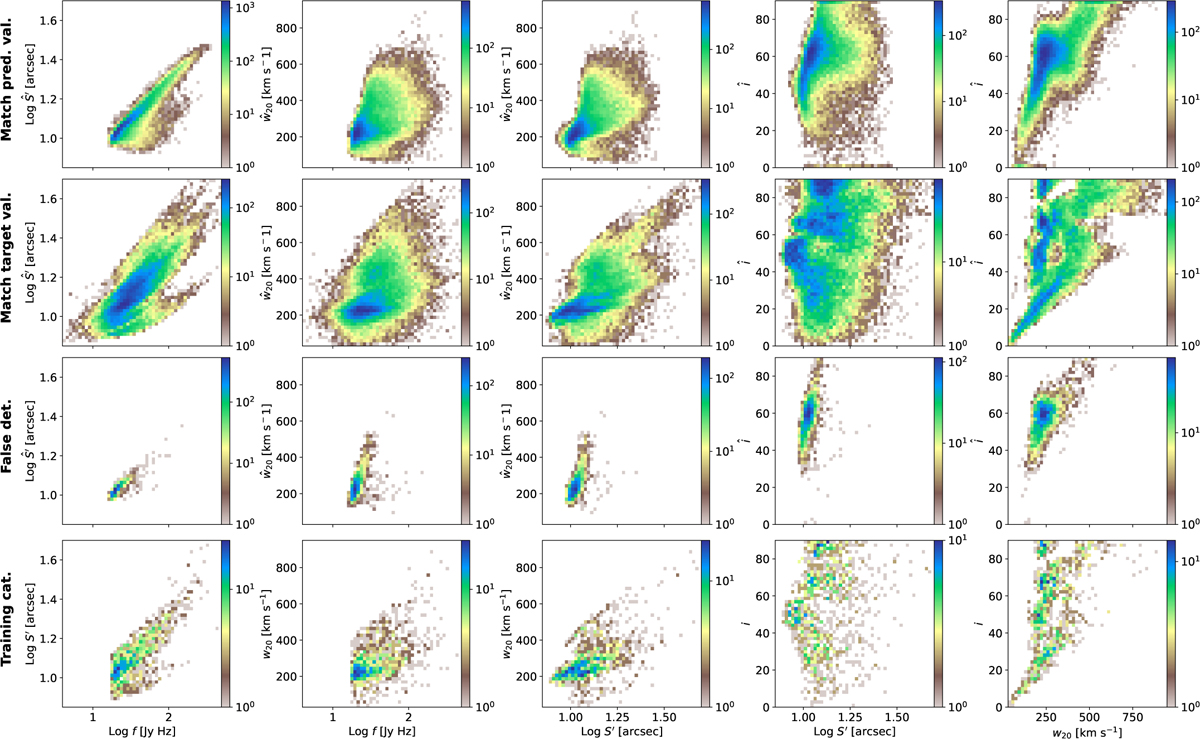
Two-dimensional histograms of selected source parameter pairs. Rows correspond to different source catalogs: the first and second rows represent matched sources from the MAIN from BT1 using the predicted and target source values, respectively; the third row represents false detections; the fourth row represents the selected training catalog from the LDEV cube.
Current usage metrics show cumulative count of Article Views (full-text article views including HTML views, PDF and ePub downloads, according to the available data) and Abstracts Views on Vision4Press platform.
Data correspond to usage on the plateform after 2015. The current usage metrics is available 48-96 hours after online publication and is updated daily on week days.
Initial download of the metrics may take a while.