Fig. B.1
Download original image
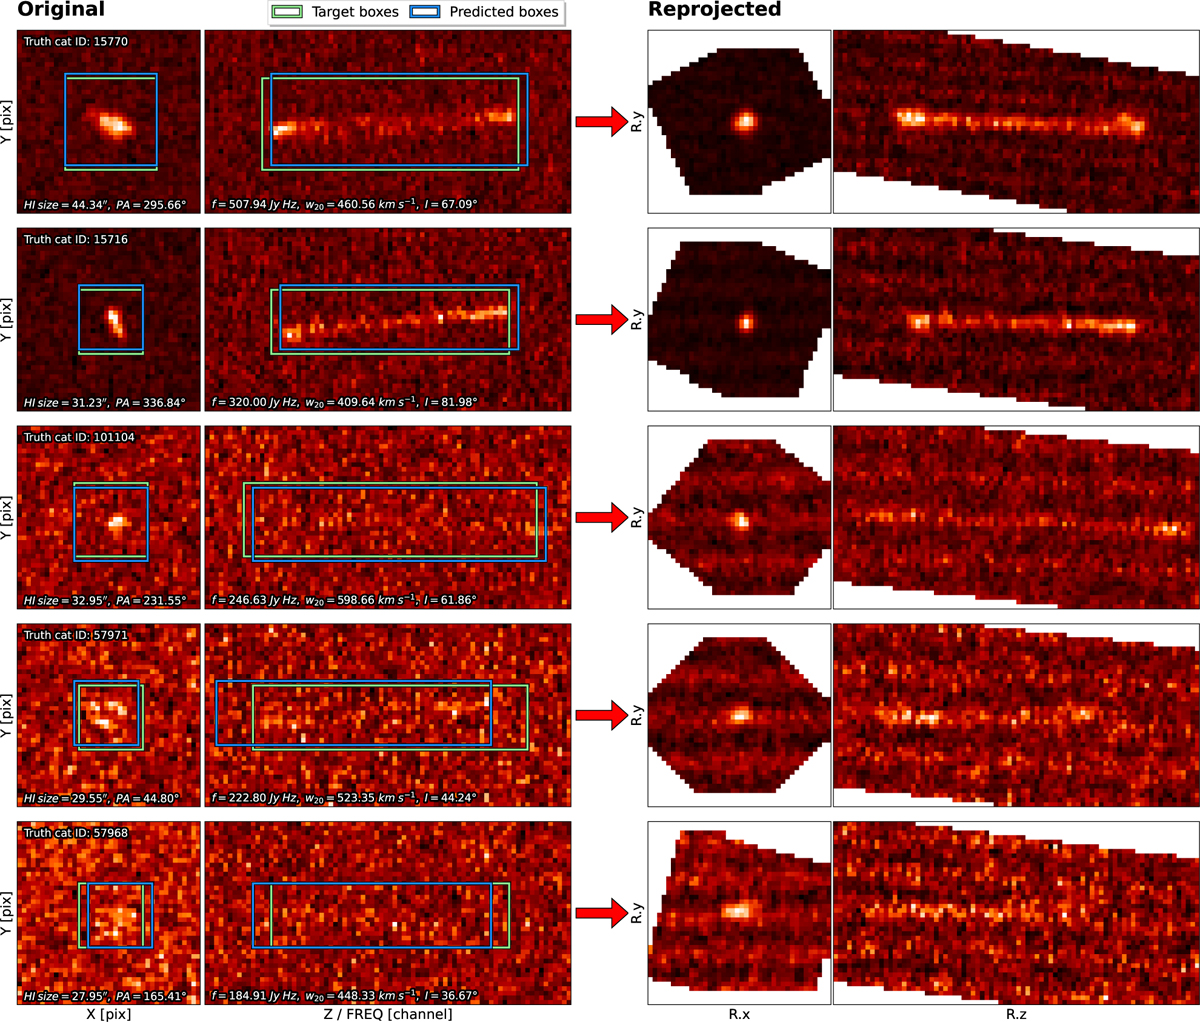
Signal projection for a subset of matched MAIN-cube detections. Each row corresponds to a source. The left column is obtained from cutouts centered on the source in the original MAIN cube, whereas the right column is obtained after reprojecting the cutout based on each source’s PA and i. For each cutout, we present two 2D projections, one in the plane of the sky by averaging over the frequency axis, and the second in a sky-frequency plane by averaging over one sky axis. Images are in arbitrary units inversely proportional to the normalized voxel intensity. The colormap is adjusted to maximize the per-image contrast. The truth catalog id and the target source properties are indicated for reference. Boxes are overplotted on the left column for each source and represent the target box in green and the corresponding detector’s prediction in blue.
Current usage metrics show cumulative count of Article Views (full-text article views including HTML views, PDF and ePub downloads, according to the available data) and Abstracts Views on Vision4Press platform.
Data correspond to usage on the plateform after 2015. The current usage metrics is available 48-96 hours after online publication and is updated daily on week days.
Initial download of the metrics may take a while.