Fig. 2
Download original image
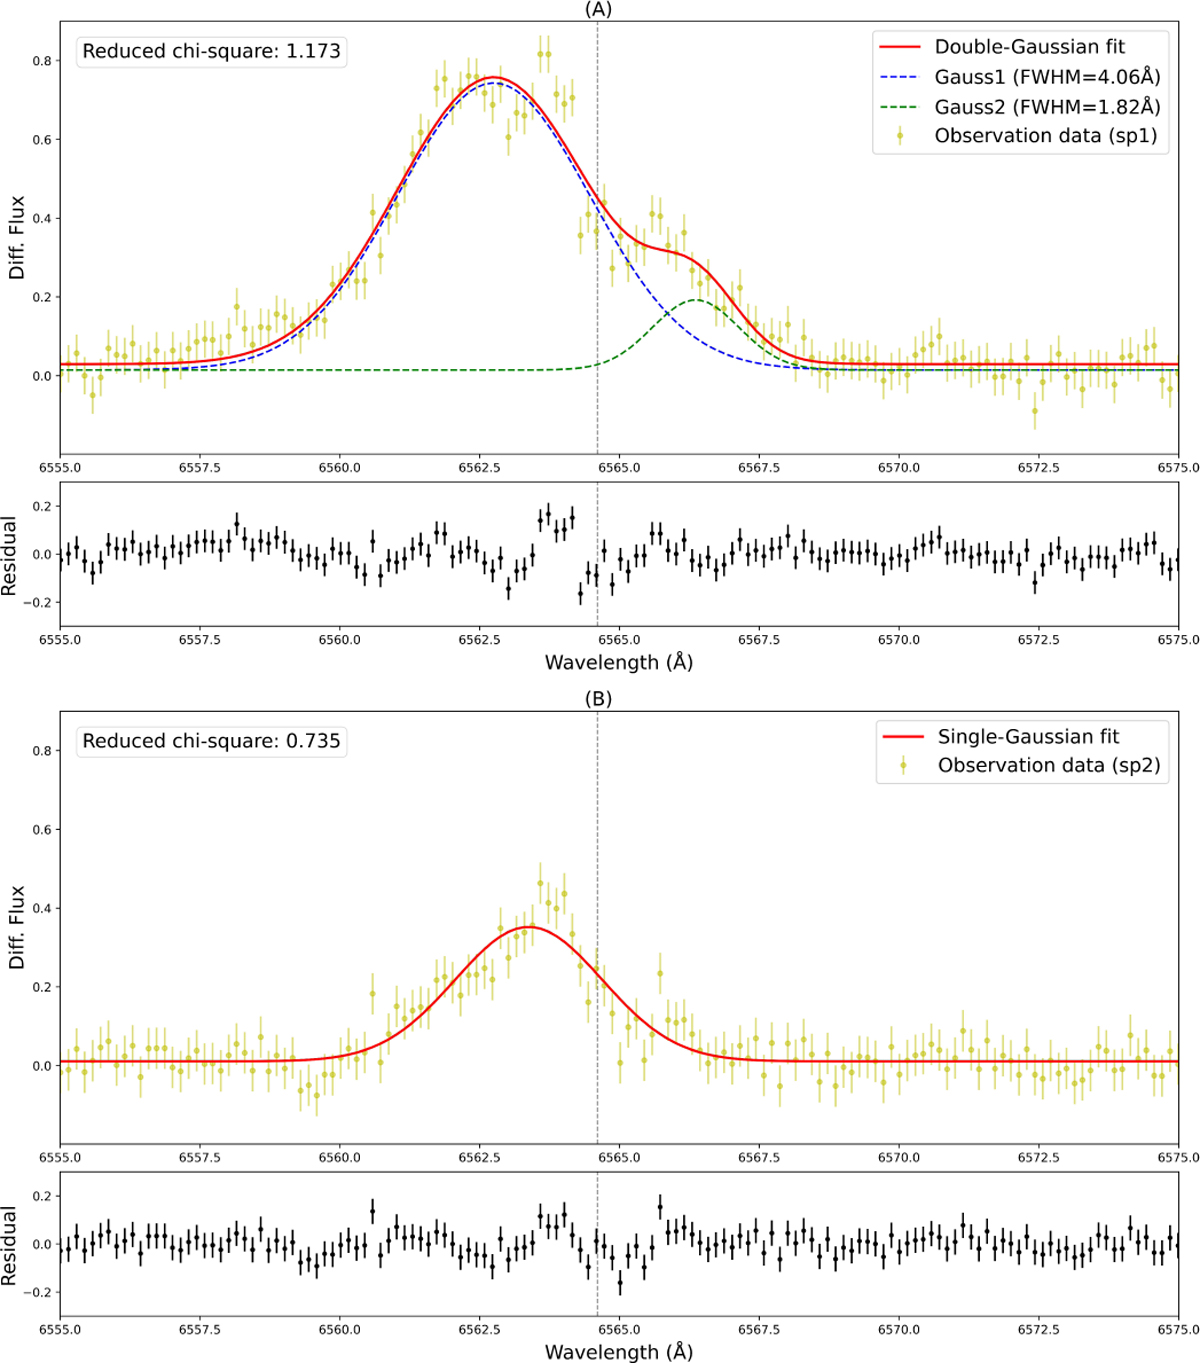
Gaussian fits to the Hα line profiles during the flare. Panel A: double-Gaussian fit to the first Hα difference profile (normalised flare spectrum minus the normalised reference spectrum). Yellow dots denote the observed Hα line profile, the solid red line shows the total Gaussian fit, the dashed blue line marks the blueshifted component, and the dashed green line marks the redshifted component. The reduced χ2 value is indicated in the upper-left corner. The vertical dashed gray line marks the Hα rest wavelength in quiescence. Panel B: single-Gaussian fit to the second Hα difference profile.
Current usage metrics show cumulative count of Article Views (full-text article views including HTML views, PDF and ePub downloads, according to the available data) and Abstracts Views on Vision4Press platform.
Data correspond to usage on the plateform after 2015. The current usage metrics is available 48-96 hours after online publication and is updated daily on week days.
Initial download of the metrics may take a while.