Fig. 4
Download original image
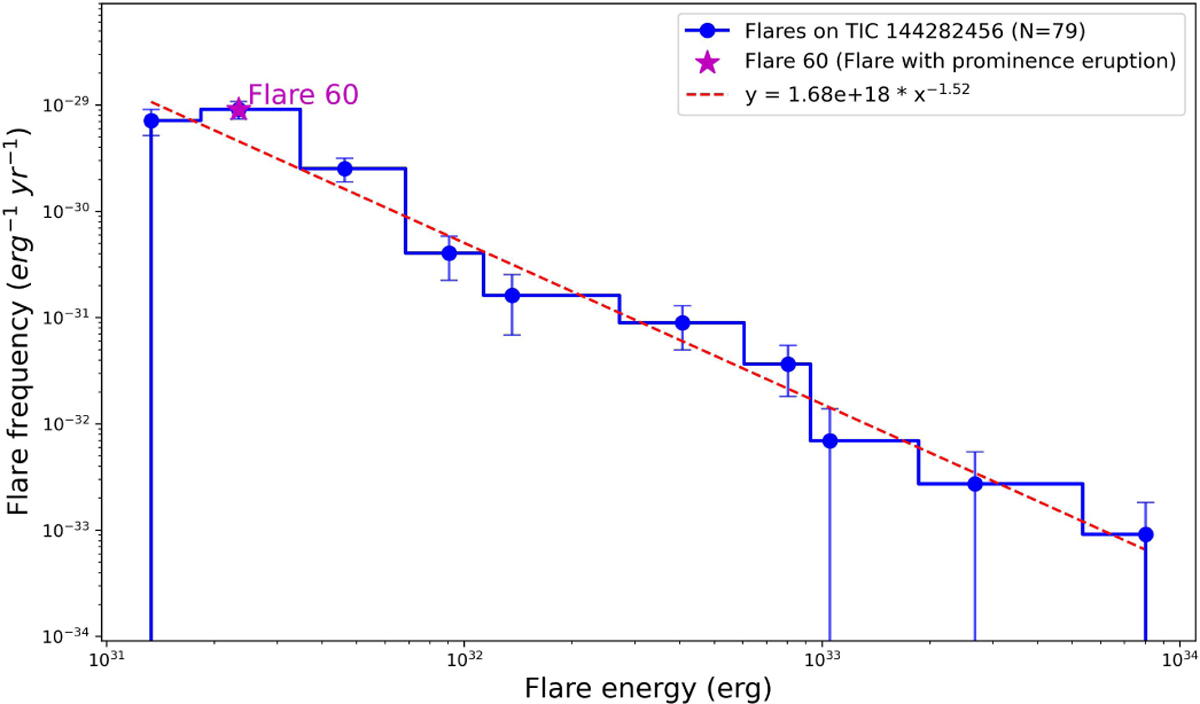
FFD of TIC 144282456. The horizontal axis shows the flare energy and the vertical axis the flare frequency. The blue circles connected by a step-like line represent the cumulative distribution of the 79 detected flares, with error bars indicating statistical uncertainties. The purple pentagram marks the special case of Flare 60, the flare accompanied by a stellar prominence eruption. The dashed red line shows the best-fit power-law relation (y = 1.68 × 10¹⁸ x−1.52), where y denotes the flare frequency and x the flare energy.
Current usage metrics show cumulative count of Article Views (full-text article views including HTML views, PDF and ePub downloads, according to the available data) and Abstracts Views on Vision4Press platform.
Data correspond to usage on the plateform after 2015. The current usage metrics is available 48-96 hours after online publication and is updated daily on week days.
Initial download of the metrics may take a while.