Open Access
Fig. C.1.
Download original image
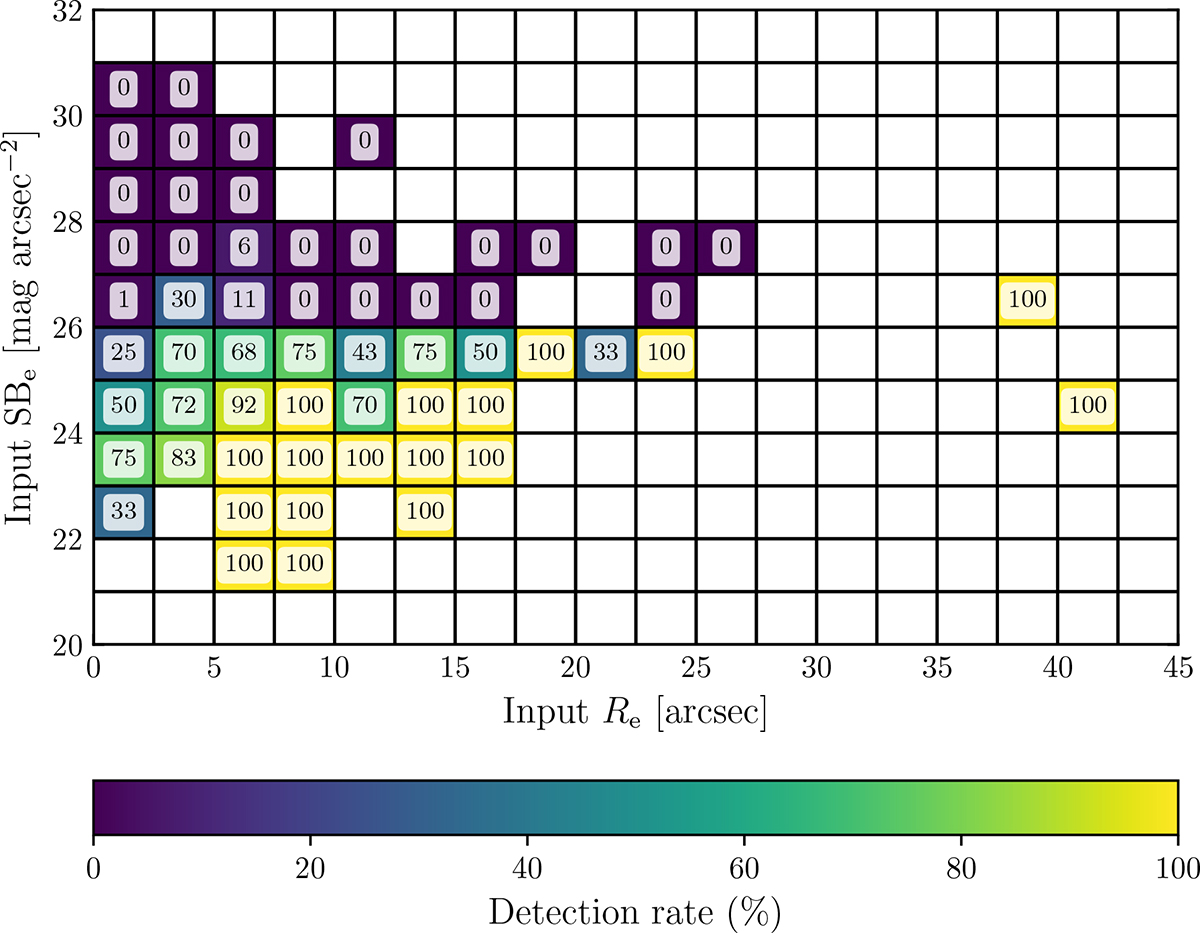
Two-dimensional histogram of the detection rate (in %) per bin of SBe and Re. In this plot, a dwarf is defined as detected if it is a single source in the MER catalogue or if the corresponding MER catalogue sources are linked by the same parent ID.
Current usage metrics show cumulative count of Article Views (full-text article views including HTML views, PDF and ePub downloads, according to the available data) and Abstracts Views on Vision4Press platform.
Data correspond to usage on the plateform after 2015. The current usage metrics is available 48-96 hours after online publication and is updated daily on week days.
Initial download of the metrics may take a while.