Open Access
Fig. F.1.
Download original image
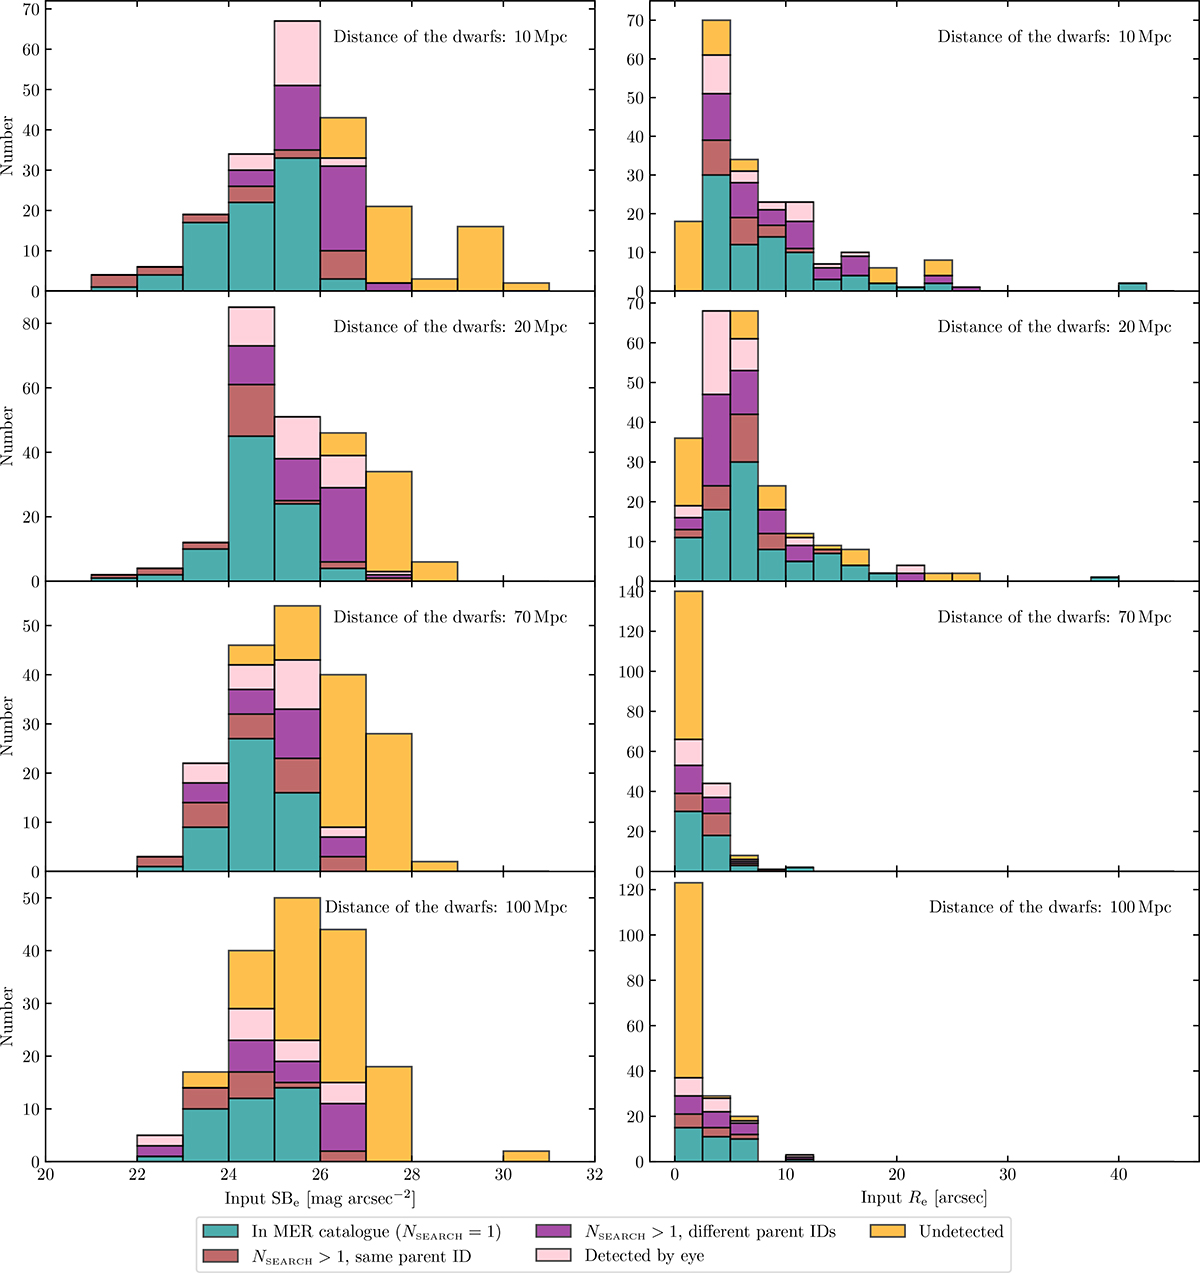
Histograms of the input SBe (left panel) and the input Re (right panel panel) of the dwarfs at 10, 20, 70 and 100 Mpc, colour-coded according to their detection by eye and in the MER catalogue, with NontSEARCH the number of MER sources found in the search radius RontSEARCH used for the cross-match.
Current usage metrics show cumulative count of Article Views (full-text article views including HTML views, PDF and ePub downloads, according to the available data) and Abstracts Views on Vision4Press platform.
Data correspond to usage on the plateform after 2015. The current usage metrics is available 48-96 hours after online publication and is updated daily on week days.
Initial download of the metrics may take a while.