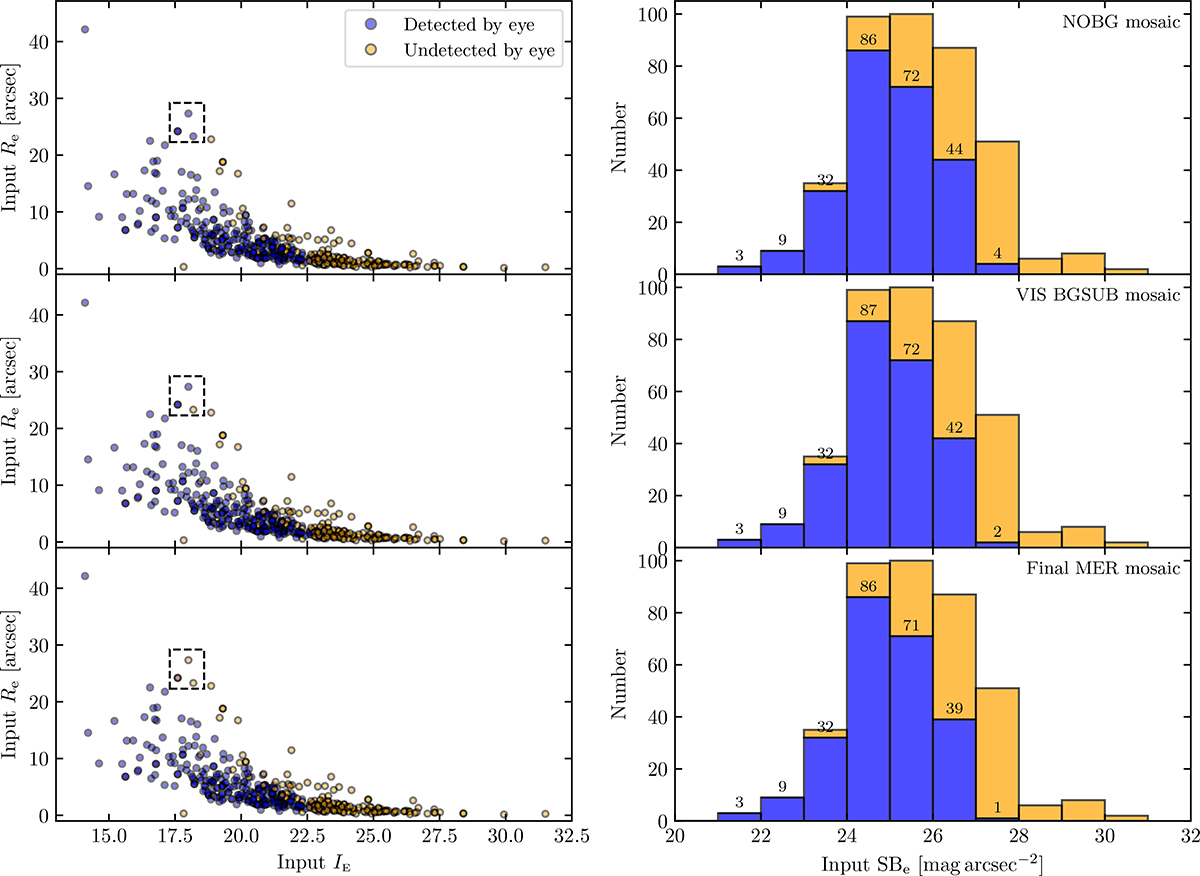
Fig. G.1.
Download original image
Input Re as a function of the input total magnitude in IE (left panel) and the corresponding histogram of the input SBe (right panel), colour-coded according to their detection or non-detection by eye in the three types of products: NOBG, VIS BGSUB, and the final MER mosaic subtracted by VIS and MER backgrounds. Only the non-nucleated dwarfs, at all distances, have been used in this analysis. We labelled the number of dwarfs that are visually detected in each SBe bin. The dashed rectangle shows examples of objects that were detected differently with the various background treatments.
Current usage metrics show cumulative count of Article Views (full-text article views including HTML views, PDF and ePub downloads, according to the available data) and Abstracts Views on Vision4Press platform.
Data correspond to usage on the plateform after 2015. The current usage metrics is available 48-96 hours after online publication and is updated daily on week days.
Initial download of the metrics may take a while.