Fig. 4.
Download original image
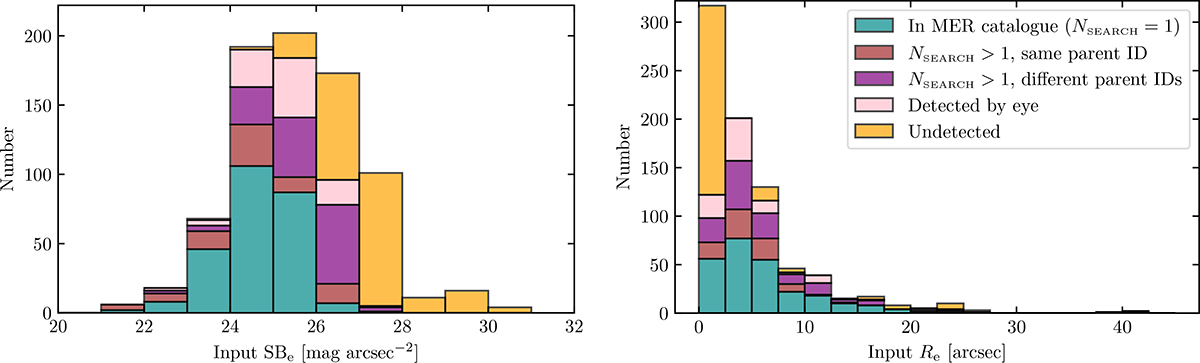
Histograms of the input SBe (left panel) and the input Re (right panel), colour-coded according to their detection by eye and in the MER catalogue. Here, NontSEARCH is the number of MER sources found by using the search radius RontSEARCH for the cross-match. It is worth noting that the dwarfs in MER catalogues and those with NontSEARCH > 1 are also detected by eye. In this plot, all the dwarfs (nucleated or not) are included. In complement of this plot, Appendix C provides a SBe-Re map of detection rate. Finally, in Appendix D, we also provide the histogram of ⟨μontI⟩ as defined in Euclid Collaboration: Marleau et al. (2026).
Current usage metrics show cumulative count of Article Views (full-text article views including HTML views, PDF and ePub downloads, according to the available data) and Abstracts Views on Vision4Press platform.
Data correspond to usage on the plateform after 2015. The current usage metrics is available 48-96 hours after online publication and is updated daily on week days.
Initial download of the metrics may take a while.