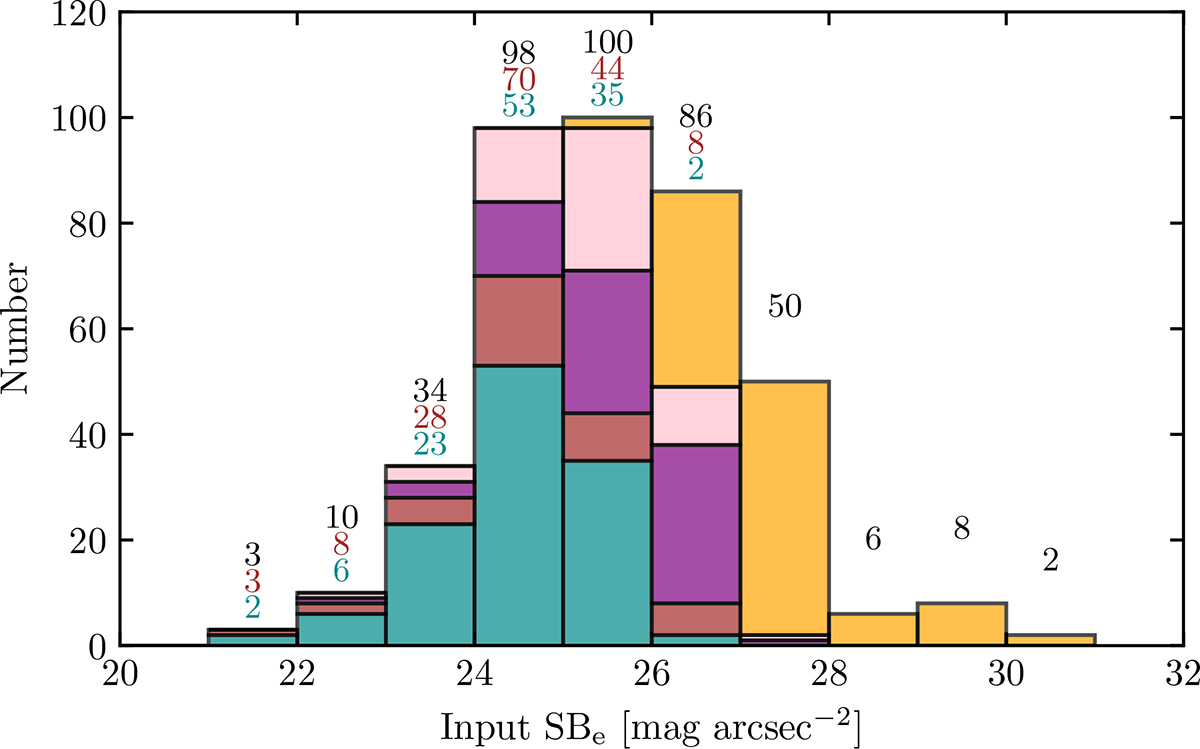
Fig. 8.
Download original image
Identical to the left panel of Fig. 4, but only for the non-nucleated dwarfs. Above each bin, the number of injected dwarfs is shown in black, the number of dwarfs recovered as either a single MER source or as multiple fragments with the same parent ID is shown in brown, and the number recovered as a single MER source is shown in cyan.
Current usage metrics show cumulative count of Article Views (full-text article views including HTML views, PDF and ePub downloads, according to the available data) and Abstracts Views on Vision4Press platform.
Data correspond to usage on the plateform after 2015. The current usage metrics is available 48-96 hours after online publication and is updated daily on week days.
Initial download of the metrics may take a while.