Fig. D.1
Download original image
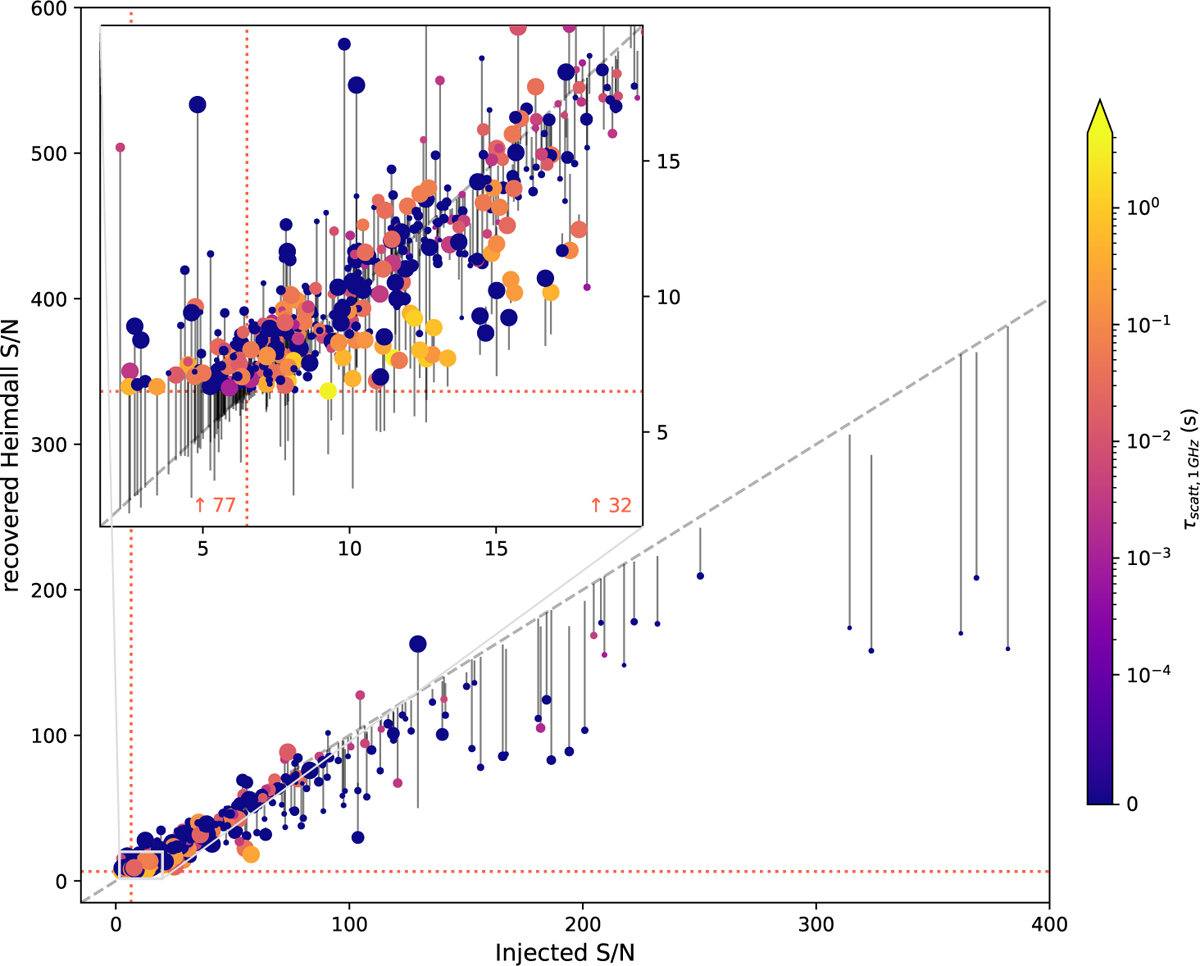
All detected injections with their injected S/Ns plotted against their recovered S/Ns by HEIMDALL. Marker sizes indicate HEIMDALL’s reported width of the injections and the colours show the scattering times with which they are injected referenced to 1 GHz. The vertical lines display a rise or drop in S/N between an SP’s discrete injected S/N and the recovered HEIMDALL S/N. 109 injections (red numbers in inset) with a discrete injected S/N below the set S/N threshold of 6.5 (dashed red lines) were unexpectedly detected due to one of the reasons listed in Sect. 3.2.3.
Current usage metrics show cumulative count of Article Views (full-text article views including HTML views, PDF and ePub downloads, according to the available data) and Abstracts Views on Vision4Press platform.
Data correspond to usage on the plateform after 2015. The current usage metrics is available 48-96 hours after online publication and is updated daily on week days.
Initial download of the metrics may take a while.