Fig. 4
Download original image
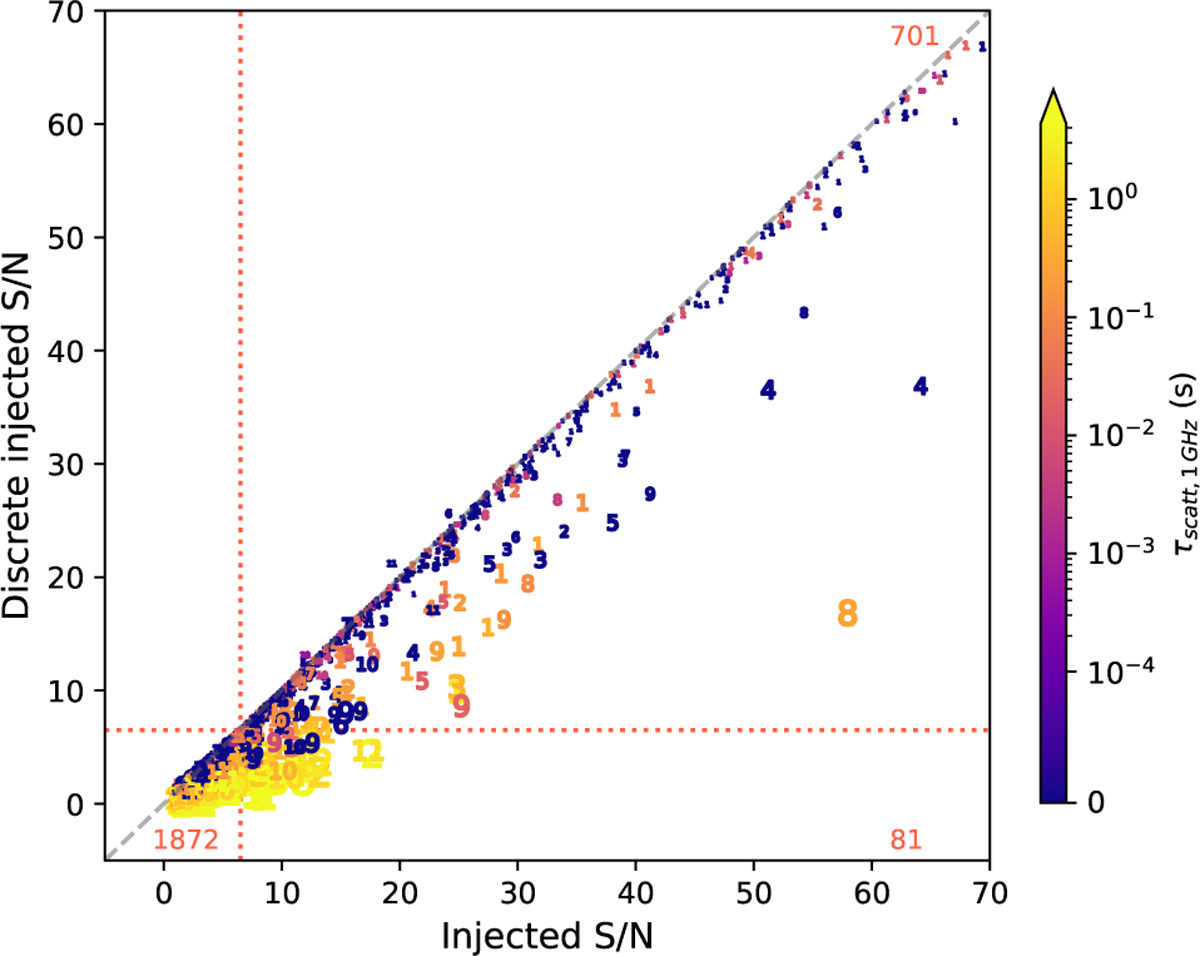
Examination of the effects on the detectability of SPs when searched for with a limited set of boxcar widths. The injected S/Ns of all injected SPs are plotted against their discrete injected S/N. The width difference between the best-fitting boxcar width and the actual propagated burst width of an SP is indicated by the plotted marker sizes. The scattering time (referenced to 1 GHz) with which it is injected is represented by the marker colours and the marker symbols, which depict the number of subcomponents an SP is composed of. The dotted red lines indicate HEIMDALL’s S/N search threshold of 6.5, and the number of SPs in each quadrant of the plot is given by the red numbers in the corners.
Current usage metrics show cumulative count of Article Views (full-text article views including HTML views, PDF and ePub downloads, according to the available data) and Abstracts Views on Vision4Press platform.
Data correspond to usage on the plateform after 2015. The current usage metrics is available 48-96 hours after online publication and is updated daily on week days.
Initial download of the metrics may take a while.