Fig. 6
Download original image
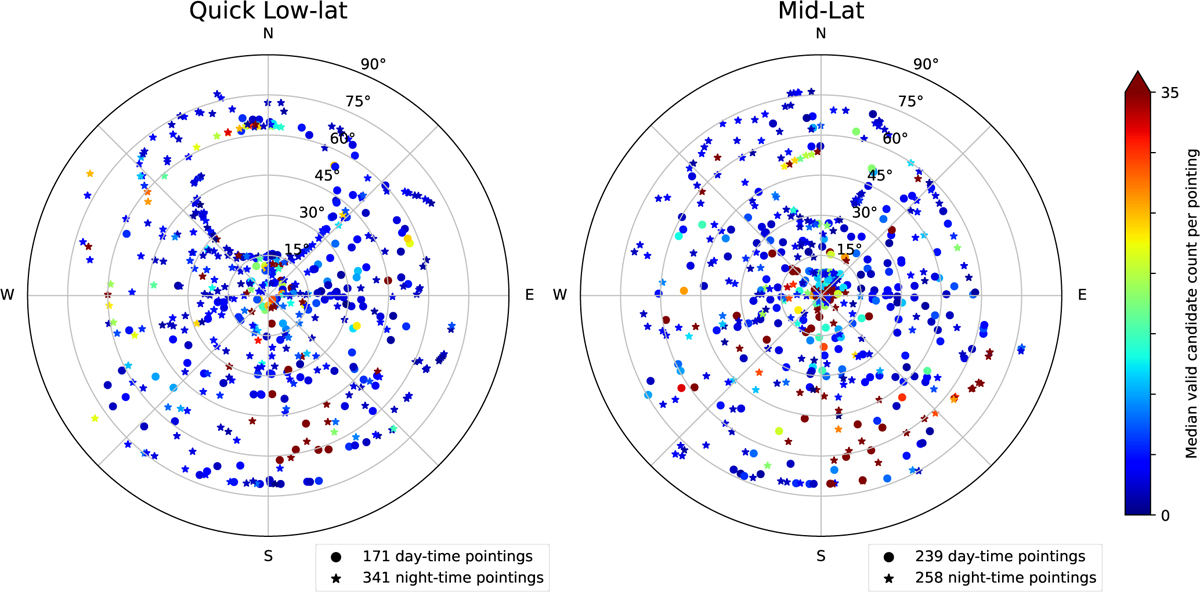
Distribution of selected quick low-lat and mid-lat PTs over azimuth and elevation. PTs recorded during the day are indicated with a circle, and those recorded at night are represented with a star. The colours show the median of the number of HEIMDALL candidates per PT before RFI excision. These values are an indication of the amount of RFI recorded per PT. Note, the upper end of the candidate count scale is truncated at the 0.9 quantile of the PTs’ candidate count, meaning that some ‘dark red’ PTs contain a factor of 10-100 more candidates than most PTs.
Current usage metrics show cumulative count of Article Views (full-text article views including HTML views, PDF and ePub downloads, according to the available data) and Abstracts Views on Vision4Press platform.
Data correspond to usage on the plateform after 2015. The current usage metrics is available 48-96 hours after online publication and is updated daily on week days.
Initial download of the metrics may take a while.