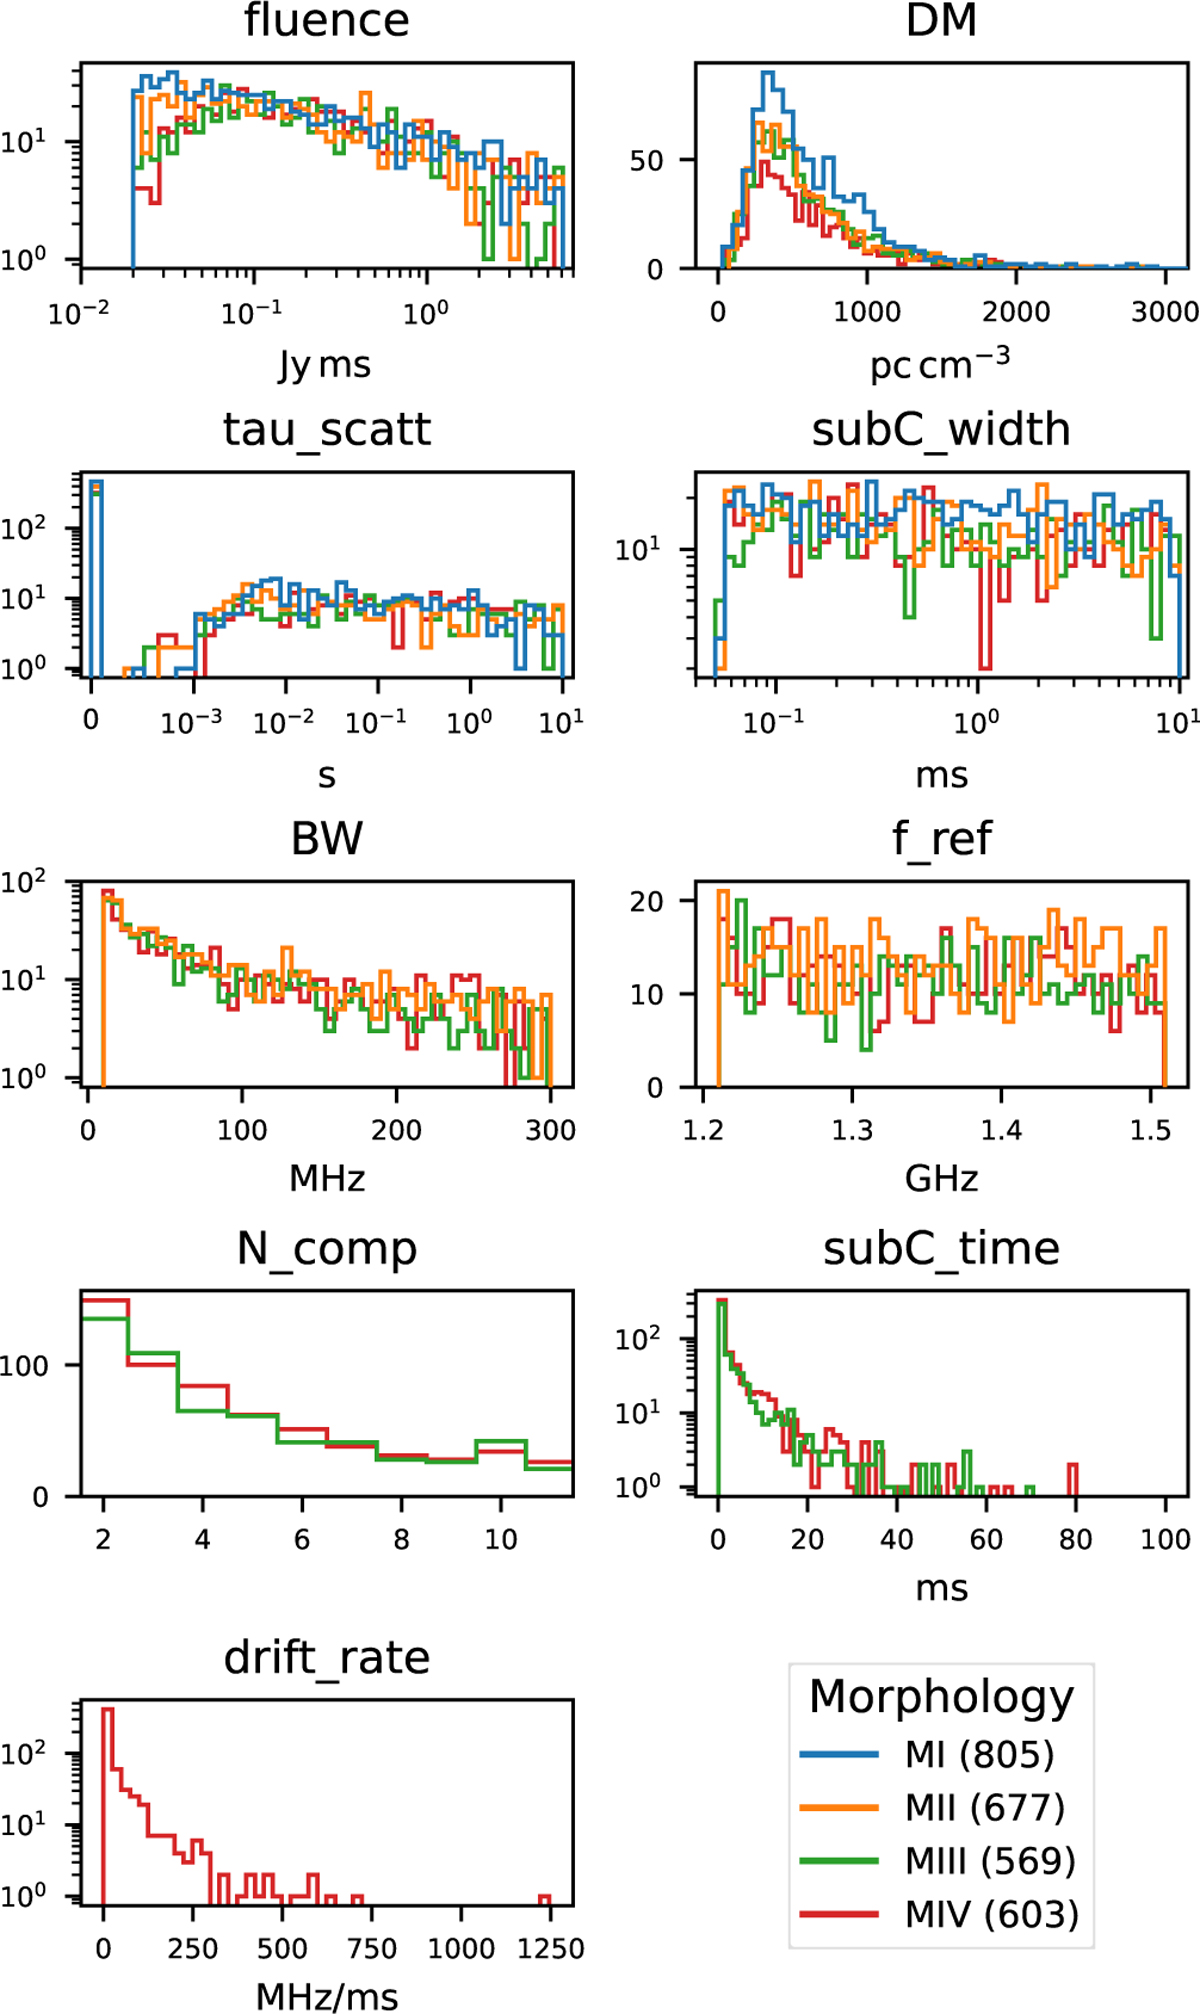
Fig. B.1
Download original image
Histograms showing the distributions of the drawn parameters that were used for the injections with an S/Ninj > 1 and injected within HEIMDALL’s search range. Table 1 lists the theoretical distributions and their limits from which these parameters were drawn. The number of injections above the applied S/Ninj threshold and within HEIMDALL’s search range are, per morphology, given in the legend behind their corresponding morphology name.
Current usage metrics show cumulative count of Article Views (full-text article views including HTML views, PDF and ePub downloads, according to the available data) and Abstracts Views on Vision4Press platform.
Data correspond to usage on the plateform after 2015. The current usage metrics is available 48-96 hours after online publication and is updated daily on week days.
Initial download of the metrics may take a while.