Fig. 1.
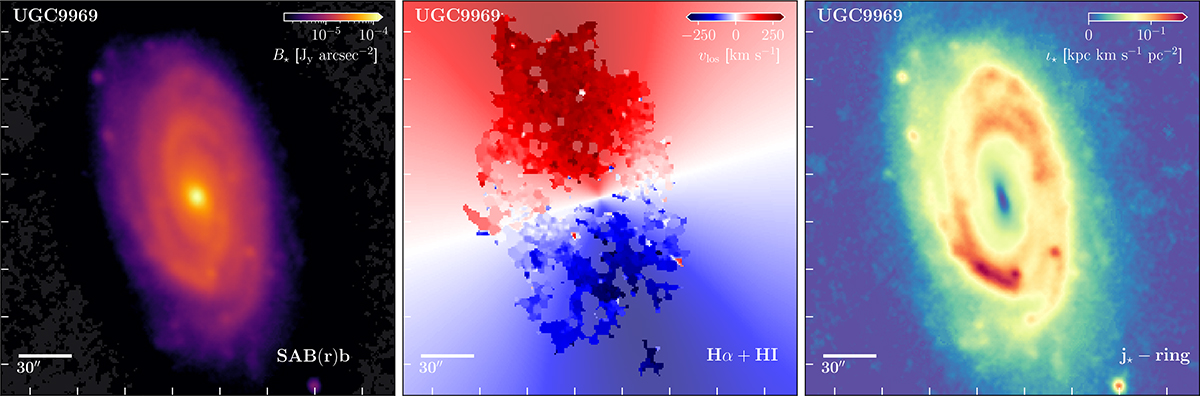
Download original image
Maps of B★, vlos, and stellar sAMSD for UGC9969. Left panel: SB in the 3.4 μm WISE W1 band. The transparent pixels correspond to the regions where the SB profile was used to fill the map after the foreground star removal process. Middle panel: Hα velocity map (solid colour vlos) on top of the Hα + H I RC projected on the sky (transparent vlos). Right panel: Stellar sAMSD per pixel computed using Eq. (5).
Current usage metrics show cumulative count of Article Views (full-text article views including HTML views, PDF and ePub downloads, according to the available data) and Abstracts Views on Vision4Press platform.
Data correspond to usage on the plateform after 2015. The current usage metrics is available 48-96 hours after online publication and is updated daily on week days.
Initial download of the metrics may take a while.