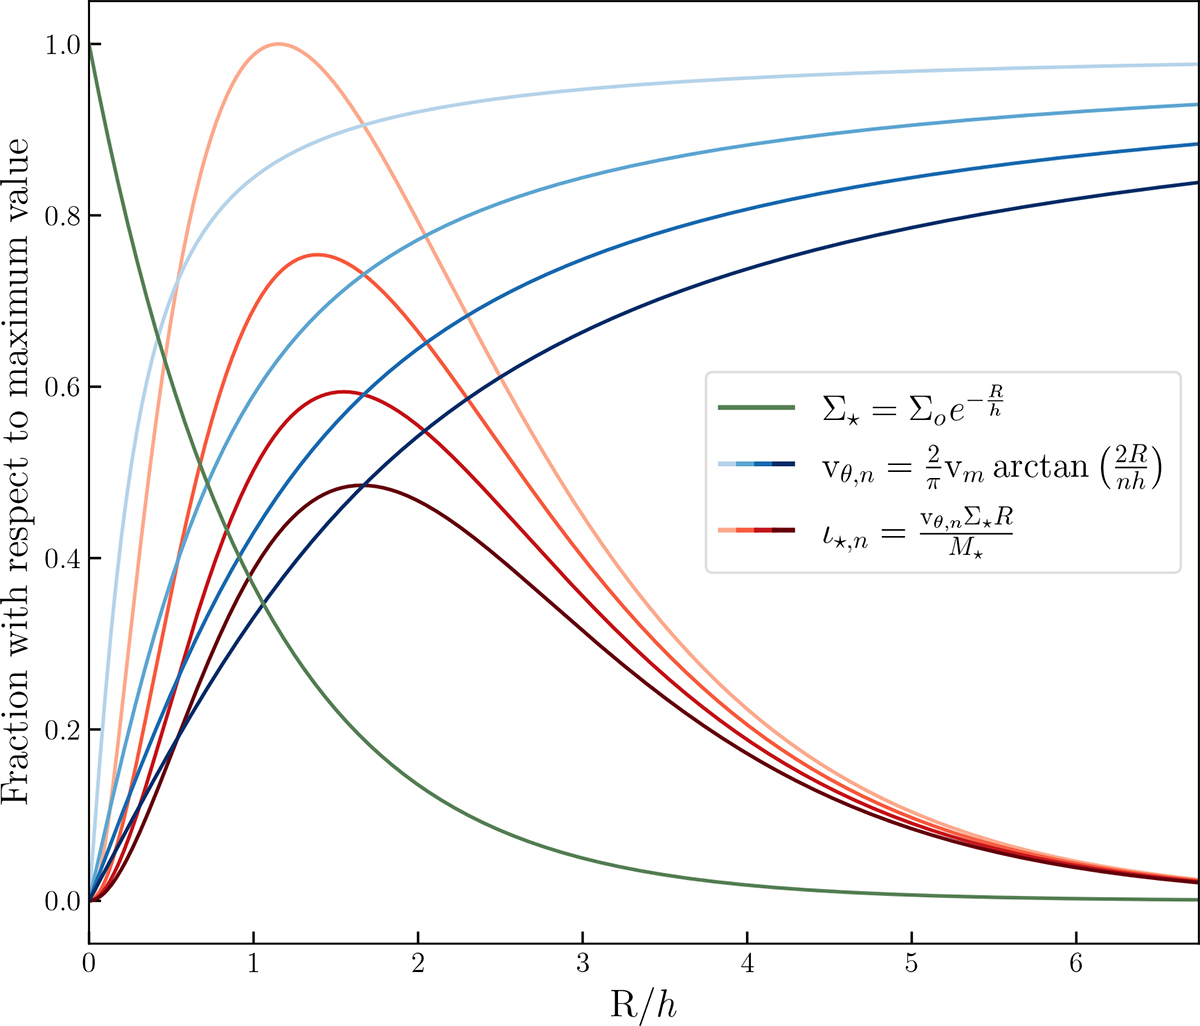
Fig. D.1.
Download original image
Radial stellar sAMSD profiles for a Freeman disc mass distribution convolved with a set of varying arctan RCs. The x-axis represents the radius normalised by the disc scale length h, while the y-axis shows each one-dimensional profile normalised with respect to its maximum value, achieving a consistent comparison of their shapes. The solid green line corresponds to the radial stellar surface mass density for a Freeman disc. The solid blue lines represent the set of tangential RCs modelled using a parametric arc-tangent RC with a constant maximum velocity and with various turnover radii, whereas the group of red lines represents the radial profiles of stellar sAMSD corresponding to these RC models (see Eq. 4). The turnover radius is set to n × h, with n equal to 0.5, 1.5, 2.5, and 3.5. The line darkness increases as n increases.
Current usage metrics show cumulative count of Article Views (full-text article views including HTML views, PDF and ePub downloads, according to the available data) and Abstracts Views on Vision4Press platform.
Data correspond to usage on the plateform after 2015. The current usage metrics is available 48-96 hours after online publication and is updated daily on week days.
Initial download of the metrics may take a while.