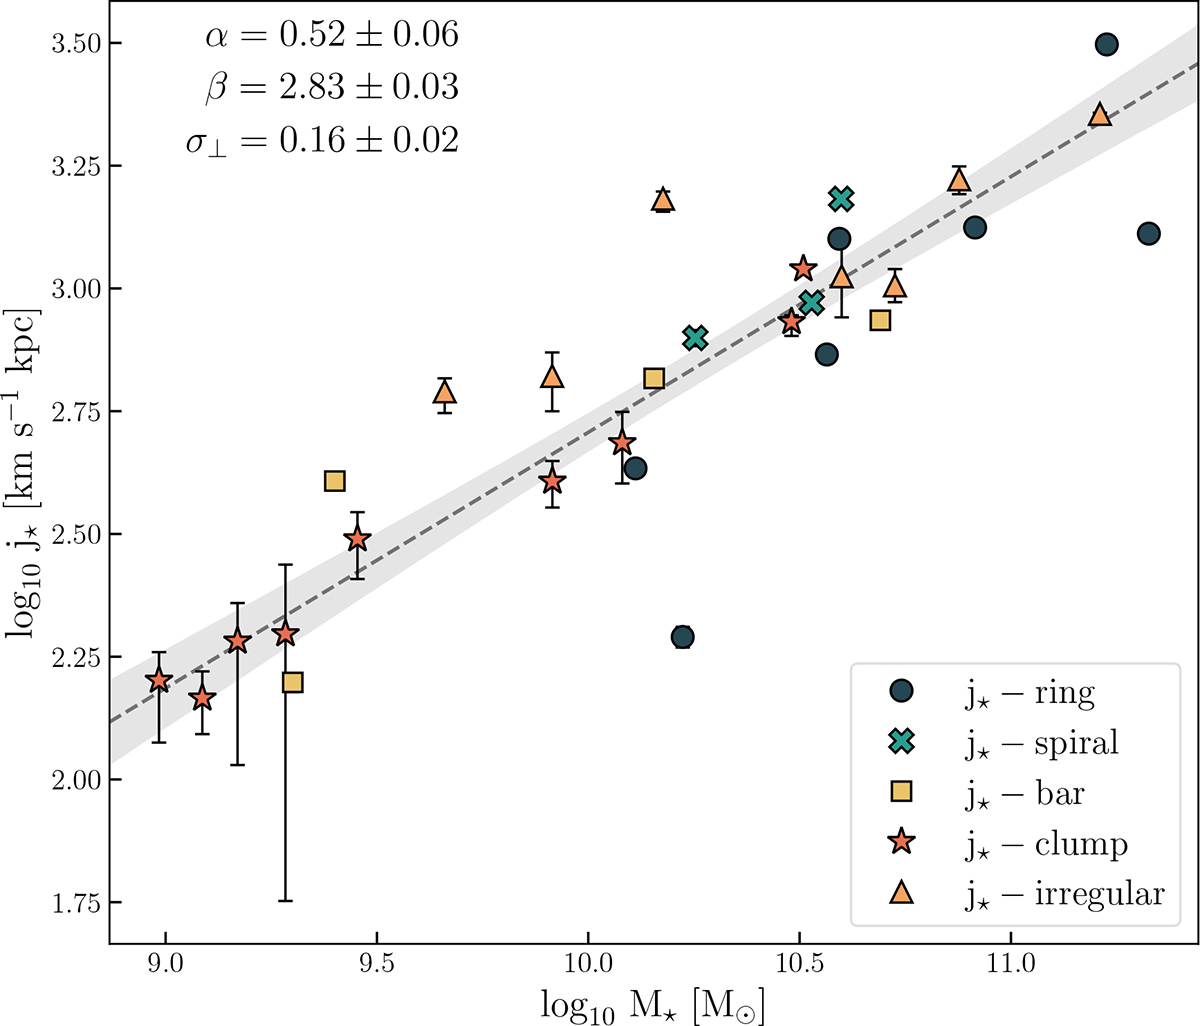
Fig. 3.
Download original image
Fall relation for our sample. The x-axis is the stellar mass, in logarithmic scale, calculated following the method described in Sect. 3.4. The y-axis is the total stellar sAM, in logarithmic scale, computed using Eq. (6). The error bars represent the variation in j★ when uncertainties in inclination and PA are considered. Each of the five j★ types described in Sect. 4.1 is represented by a different colour and marker, as can be seen in the legend box. The dotted grey line and the shaded region around it are the best fit of the Fall relation for our sample, with its respective 1σ uncertainty. The alpha coefficient, the zero point, and the intrinsic scatter for the relation are displayed in the upper-left corner.
Current usage metrics show cumulative count of Article Views (full-text article views including HTML views, PDF and ePub downloads, according to the available data) and Abstracts Views on Vision4Press platform.
Data correspond to usage on the plateform after 2015. The current usage metrics is available 48-96 hours after online publication and is updated daily on week days.
Initial download of the metrics may take a while.