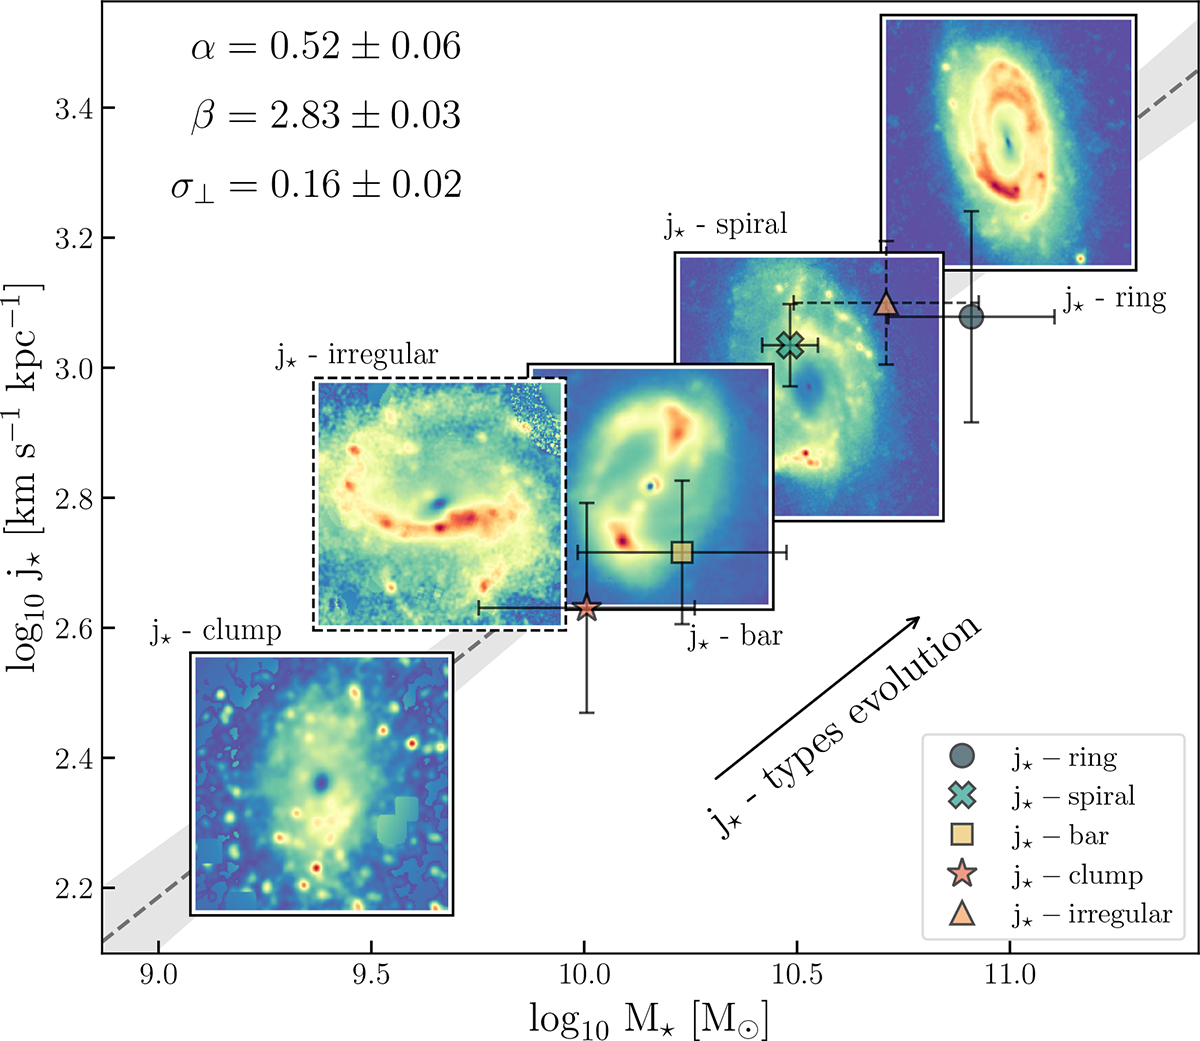
Fig. 4.
Download original image
Morpho-kinematic evolution diagram along the Fall relation. The average M★ and j★ for each morpho-kinematic class, and their 1σ standard deviations, are represented following the colour and marker scheme introduced in Fig. 3. The stellar sAMSD maps for the representatives of the five j★ types are arranged on the j★-M★ plane in the location corresponding to their stellar disc mass and total stellar sAM. Each galaxy is labelled according to its morpho-kinematics. Starting from the lower-left corner and moving up along the best-fit line for our sample, we have UGC8490, UGC10359, UGC10470, UGC6537, and UGC9969. The axes and the parameters in the upper-left corner are the same as in Fig. 3.
Current usage metrics show cumulative count of Article Views (full-text article views including HTML views, PDF and ePub downloads, according to the available data) and Abstracts Views on Vision4Press platform.
Data correspond to usage on the plateform after 2015. The current usage metrics is available 48-96 hours after online publication and is updated daily on week days.
Initial download of the metrics may take a while.