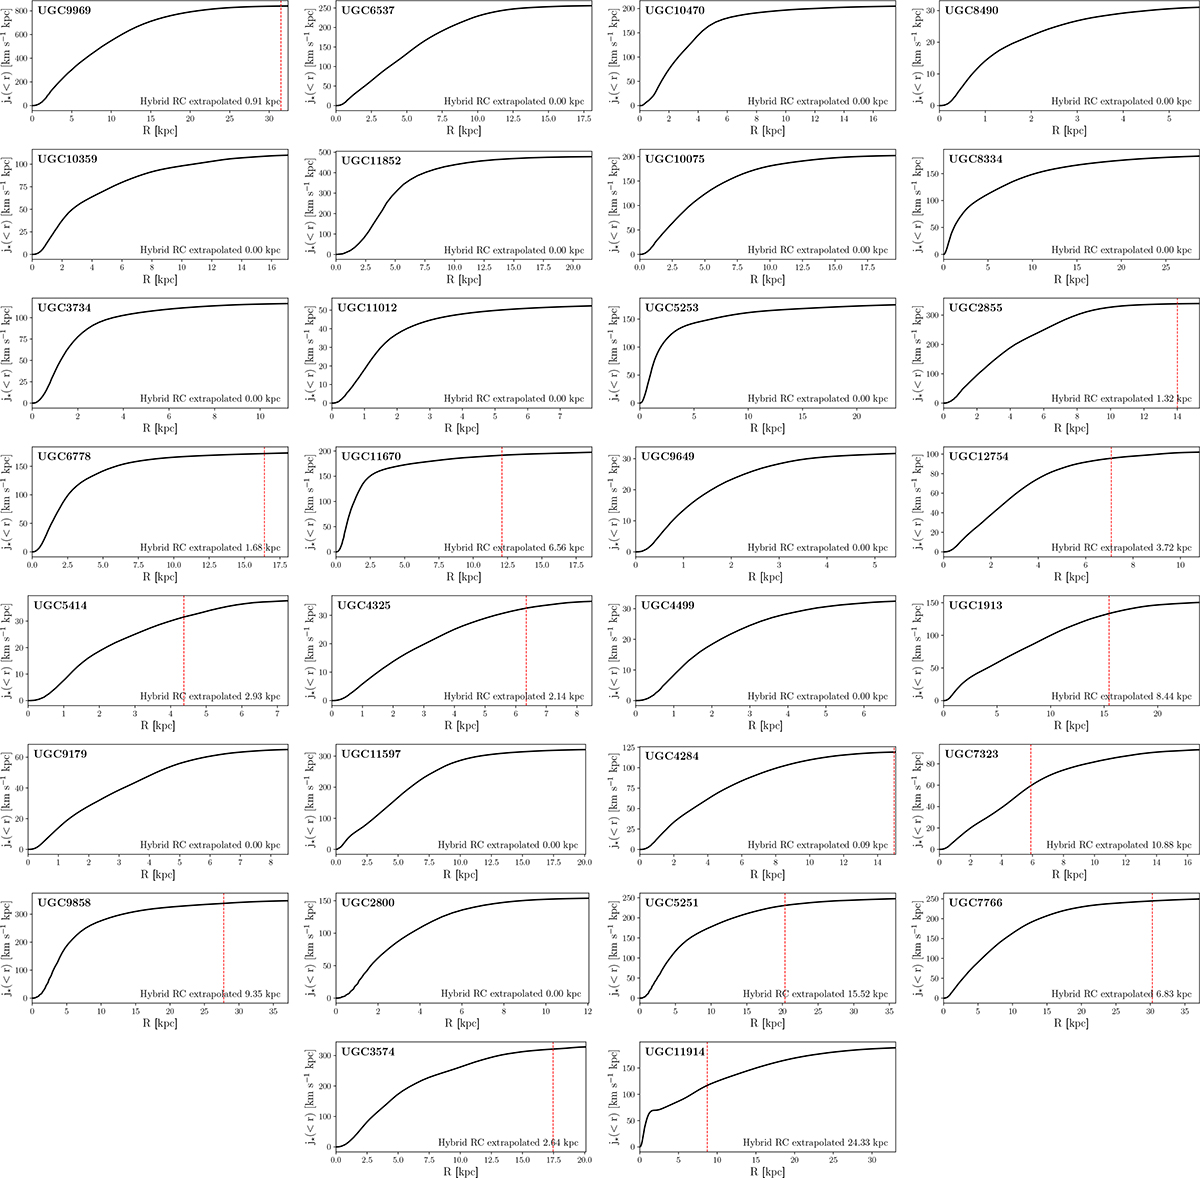
Fig. B.1.
Download original image
Cumulative stellar sAM profiles for UGC9969, UGC6537, UGC10470, UGC8490, UGC10359, UGC11852, UGC10075, UGC8334, UGC3734, UGC11012, UGC5253, UGC2855, UGC6778, UGC11670, UGC9649, UGC12754, UGC5414, UGC4325, UGC4499, UGC1913, UGC9179, UGC11597, UGC4284, UGC7323, UGC9858, UGC2800, UGC5251, UGC7766, UGC3574 and UGC11914. All the profiles are shown until they reach their Rmax. The dashed red line shows the last available radius in the hybrid RC of galaxies where extrapolation was necessary. The extrapolation remains below 50% of Rmax for 13 out of 15 galaxies. The impact on j★(< r) is limited, as these extrapolations only induce a median rise of 3%. The rise in j★(< r) is between 36% and 38% for only two galaxies, between 11% and 17% for two other galaxies, and below 7% for all other galaxies.
Current usage metrics show cumulative count of Article Views (full-text article views including HTML views, PDF and ePub downloads, according to the available data) and Abstracts Views on Vision4Press platform.
Data correspond to usage on the plateform after 2015. The current usage metrics is available 48-96 hours after online publication and is updated daily on week days.
Initial download of the metrics may take a while.