Fig. 1.
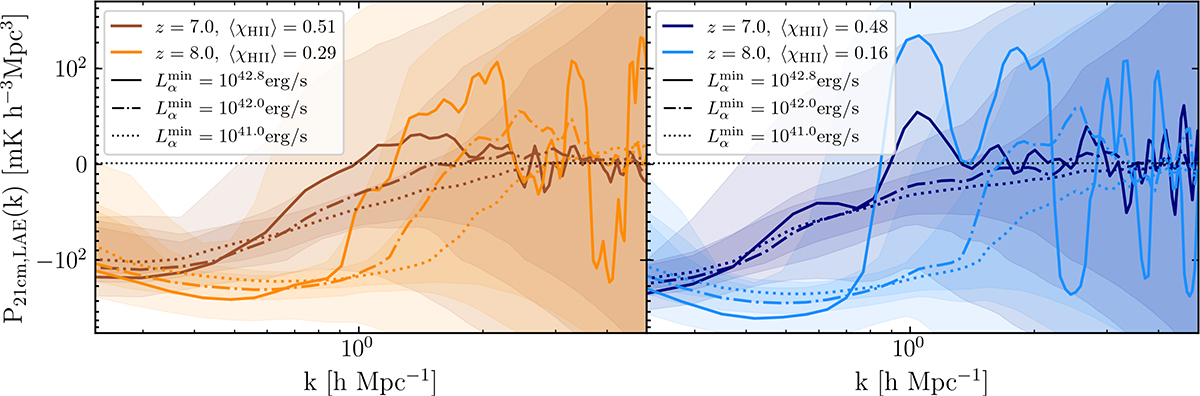
Download original image
21cm-LAE cross-power spectrum at z = 7 and 8 for the faint galaxy (MHDEC, left) and bright galaxy (MHINC, right) reionisation scenarios (Hutter et al. 2023a) and different minimum observed Lyman-α luminosities of Lαmin = 1041.0 erg/s (dotted lines), 1042.0 erg/s (dash-dotted lines), 1042.8 erg/s (solid lines). Shaded regions depict the observational uncertainties for a spectroscopic survey (σz = 0.001) covering a FoV of 25 deg2 assuming the SKA-Low1 AA4 antenna layout and a moderate foreground model, see Section 3. The cross-power spectrum values shown are interpolated from 65 and 68 linearly spaced k bins (following the k binning described in Section 3) at redshifts z = 7 and 8, respectively, and smoothed with a Gaussian kernel of standard deviation σ = 1 bin.
Current usage metrics show cumulative count of Article Views (full-text article views including HTML views, PDF and ePub downloads, according to the available data) and Abstracts Views on Vision4Press platform.
Data correspond to usage on the plateform after 2015. The current usage metrics is available 48-96 hours after online publication and is updated daily on week days.
Initial download of the metrics may take a while.