Fig. A.1.
Download original image
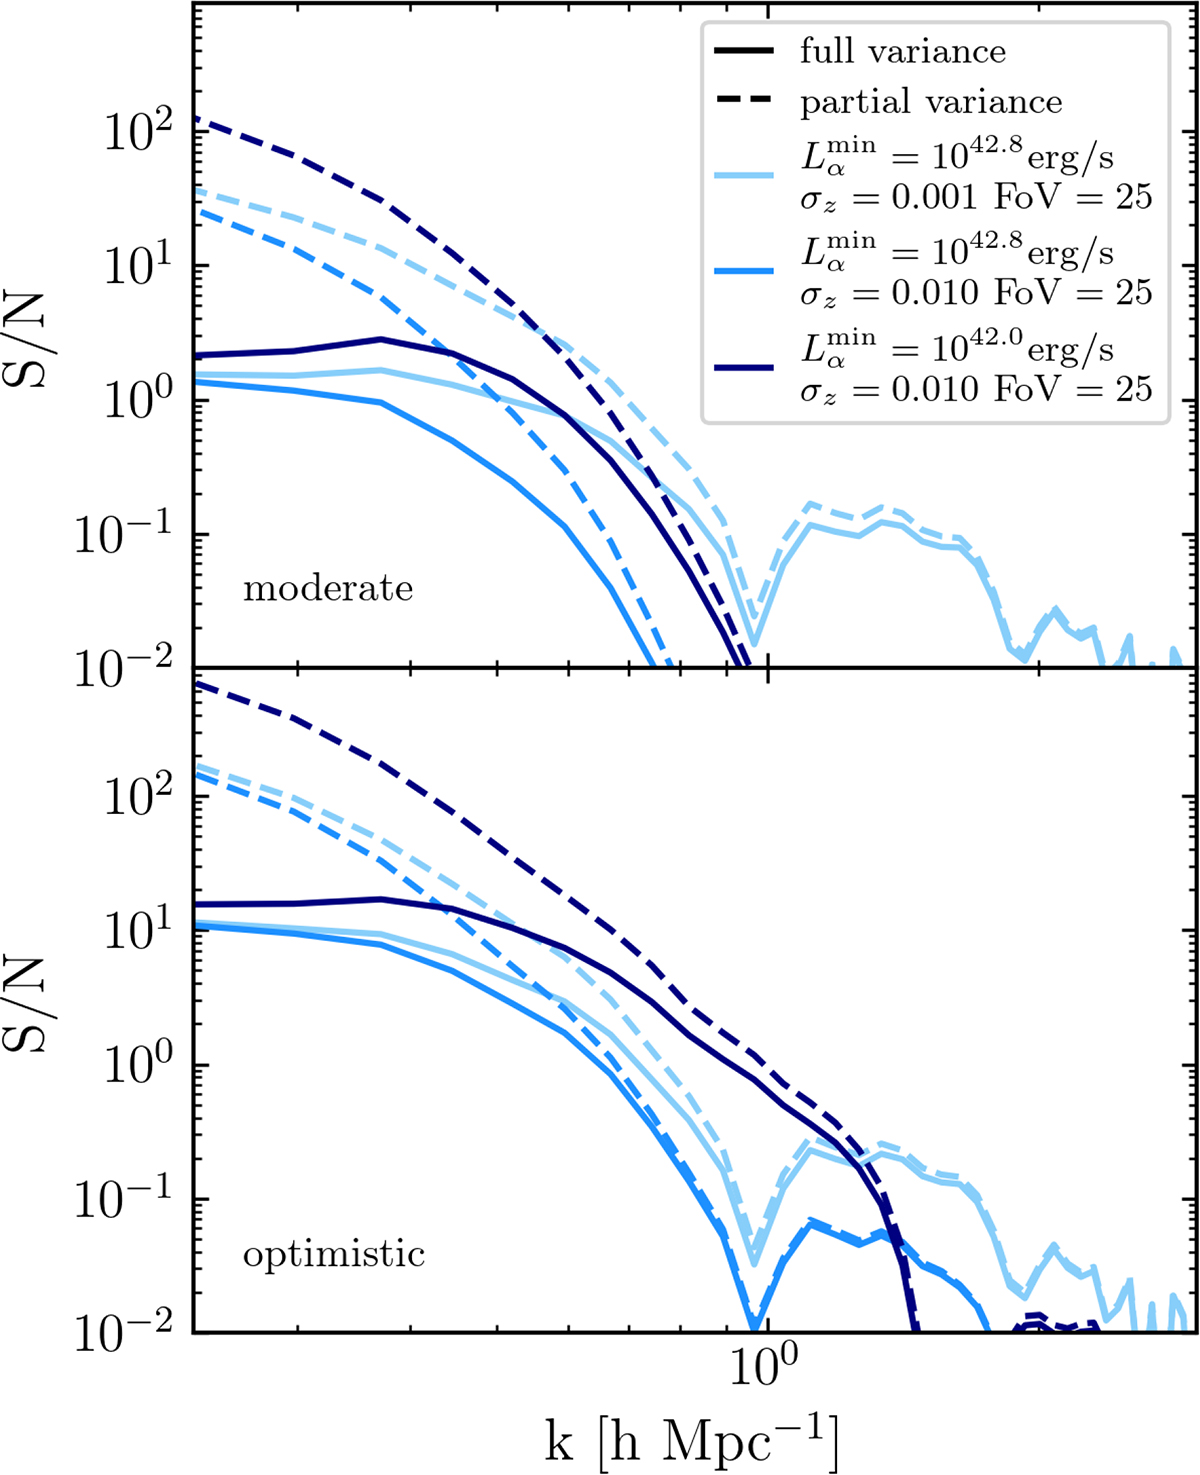
Signal-to-noise ratio of the z = 7 MHDEC 21cm–LAE cross-power spectrum P21, LAE(k) as a function of wavenumber k assuming the moderate (top) and optimistic (bottom) foreground model for considering full uncertainties (solid lines) and uncertainties omitting the auto power spectra. Coloured lines show results for varying survey configurations.
Current usage metrics show cumulative count of Article Views (full-text article views including HTML views, PDF and ePub downloads, according to the available data) and Abstracts Views on Vision4Press platform.
Data correspond to usage on the plateform after 2015. The current usage metrics is available 48-96 hours after online publication and is updated daily on week days.
Initial download of the metrics may take a while.