Fig. 3.
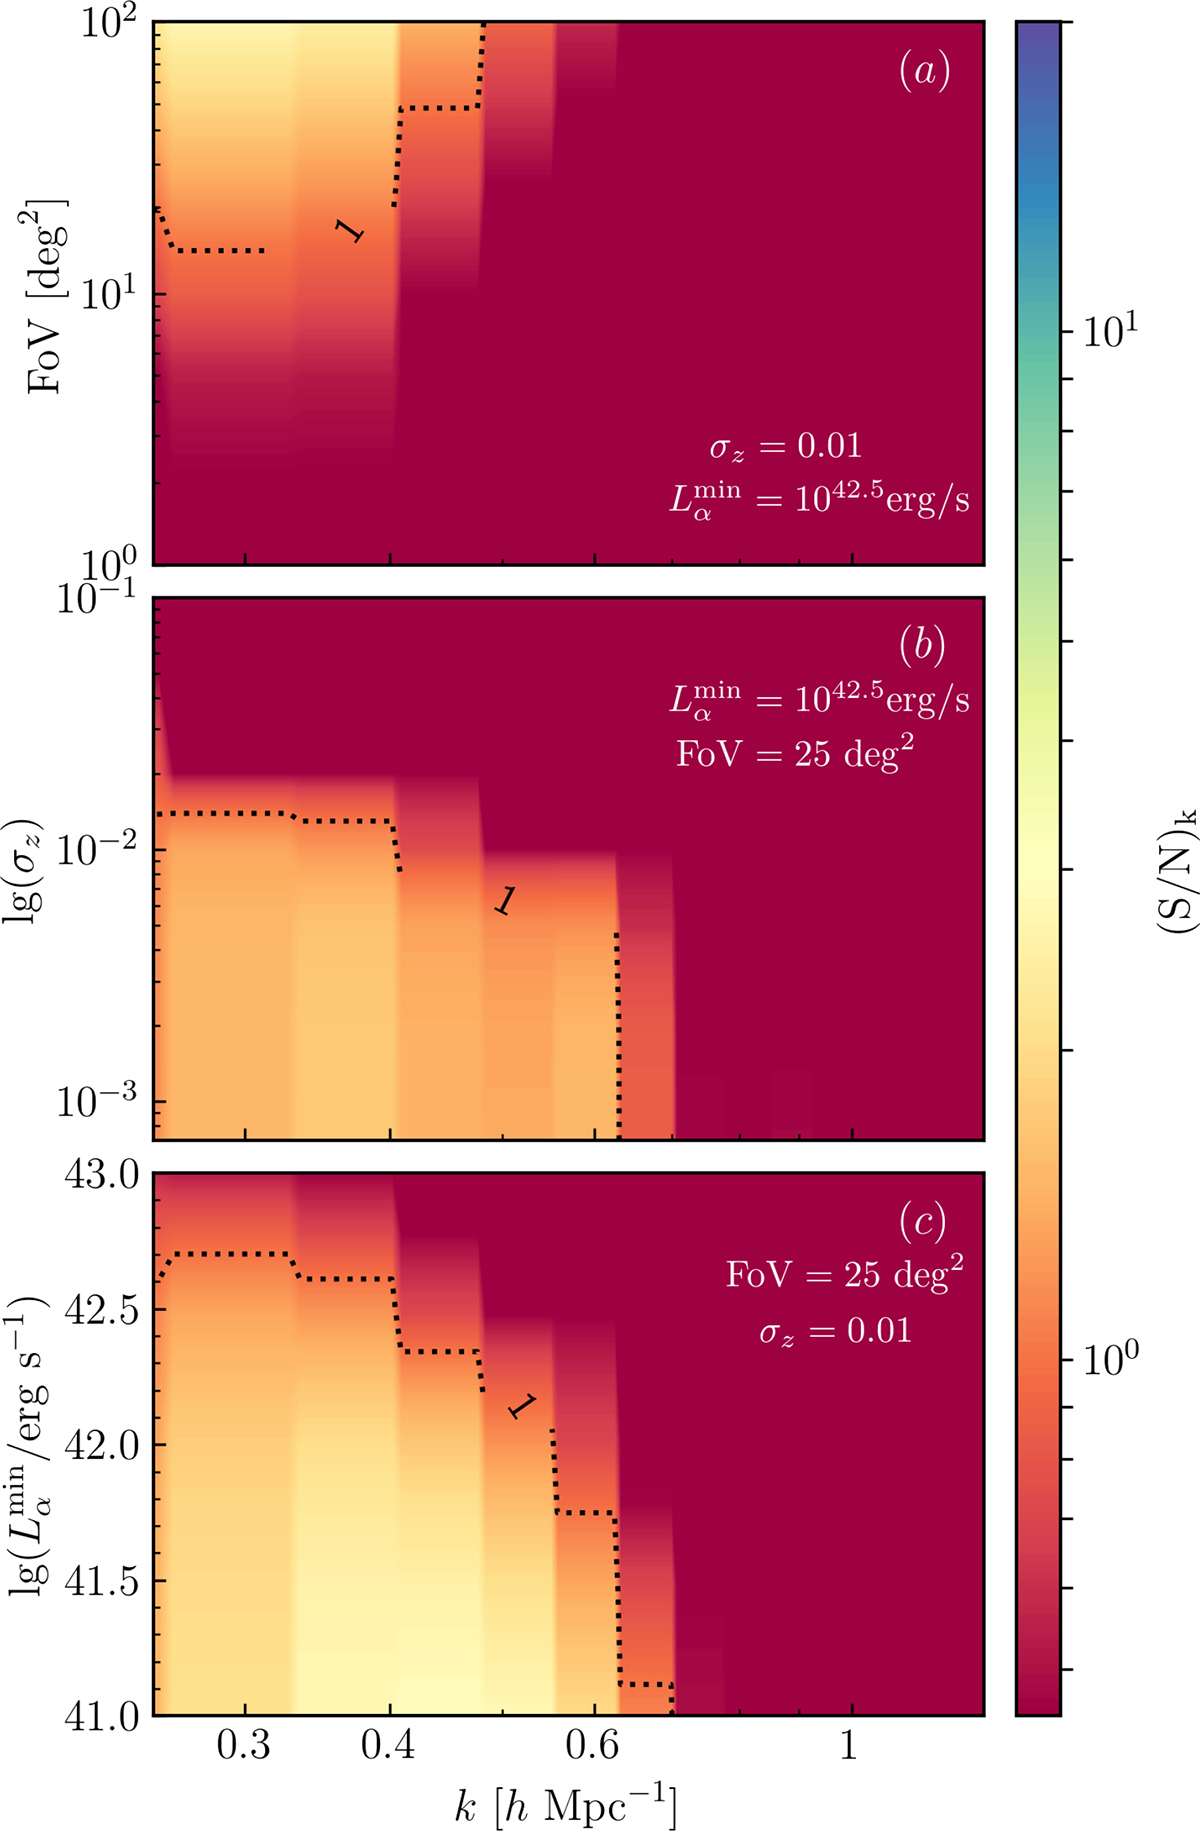
Download original image
Signal-to-noise ratio of the 21cm–LAE cross-power spectrum P21, LAE(k) as a function of wavenumber k for different observational configurations. The top, middle, and bottom panels correspond to varying FoV, galaxy redshift uncertainty, σz, and minimum Lyman-α, luminosity Lαmin, respectively. The 21cm signal noise is computed assuming the SKA-Low1 AA4 antenna layout and a moderate foreground model.
Current usage metrics show cumulative count of Article Views (full-text article views including HTML views, PDF and ePub downloads, according to the available data) and Abstracts Views on Vision4Press platform.
Data correspond to usage on the plateform after 2015. The current usage metrics is available 48-96 hours after online publication and is updated daily on week days.
Initial download of the metrics may take a while.