Fig. 5.
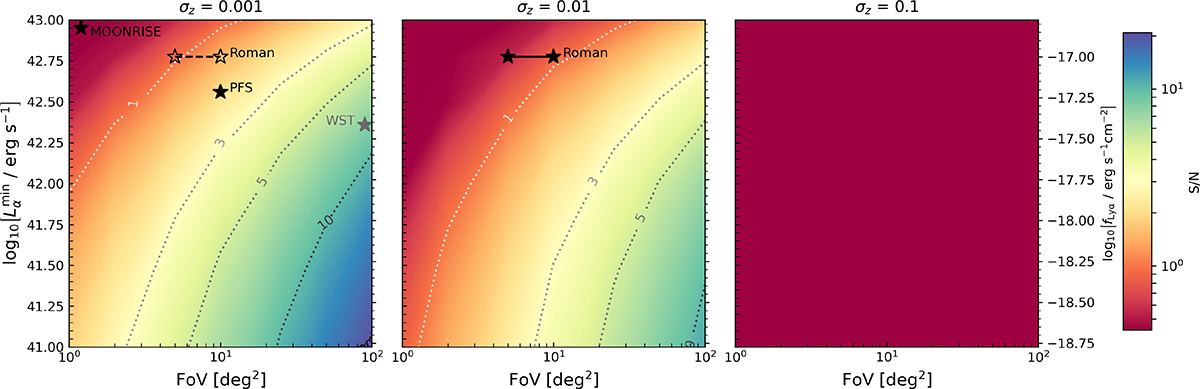
Download original image
Total S/N of the 21cm–LAE cross-power spectrum in the MHDEC reionisation scenario as a function of survey FoV and the minimum Lyman-α luminosity, Lαmin, shown for spectroscopic (left), grism (centre) and photometric-like (right) surveys at z = 7. The 21cm signal noise was computed assuming the SKA-Low1 AA4 antenna layout and a moderate foreground model. Black stars mark potential LAE surveys at z ≃ 7 that could be cross-correlated with SKA 21cm data (see also Table 1).
Current usage metrics show cumulative count of Article Views (full-text article views including HTML views, PDF and ePub downloads, according to the available data) and Abstracts Views on Vision4Press platform.
Data correspond to usage on the plateform after 2015. The current usage metrics is available 48-96 hours after online publication and is updated daily on week days.
Initial download of the metrics may take a while.