Fig. 10.
Download original image
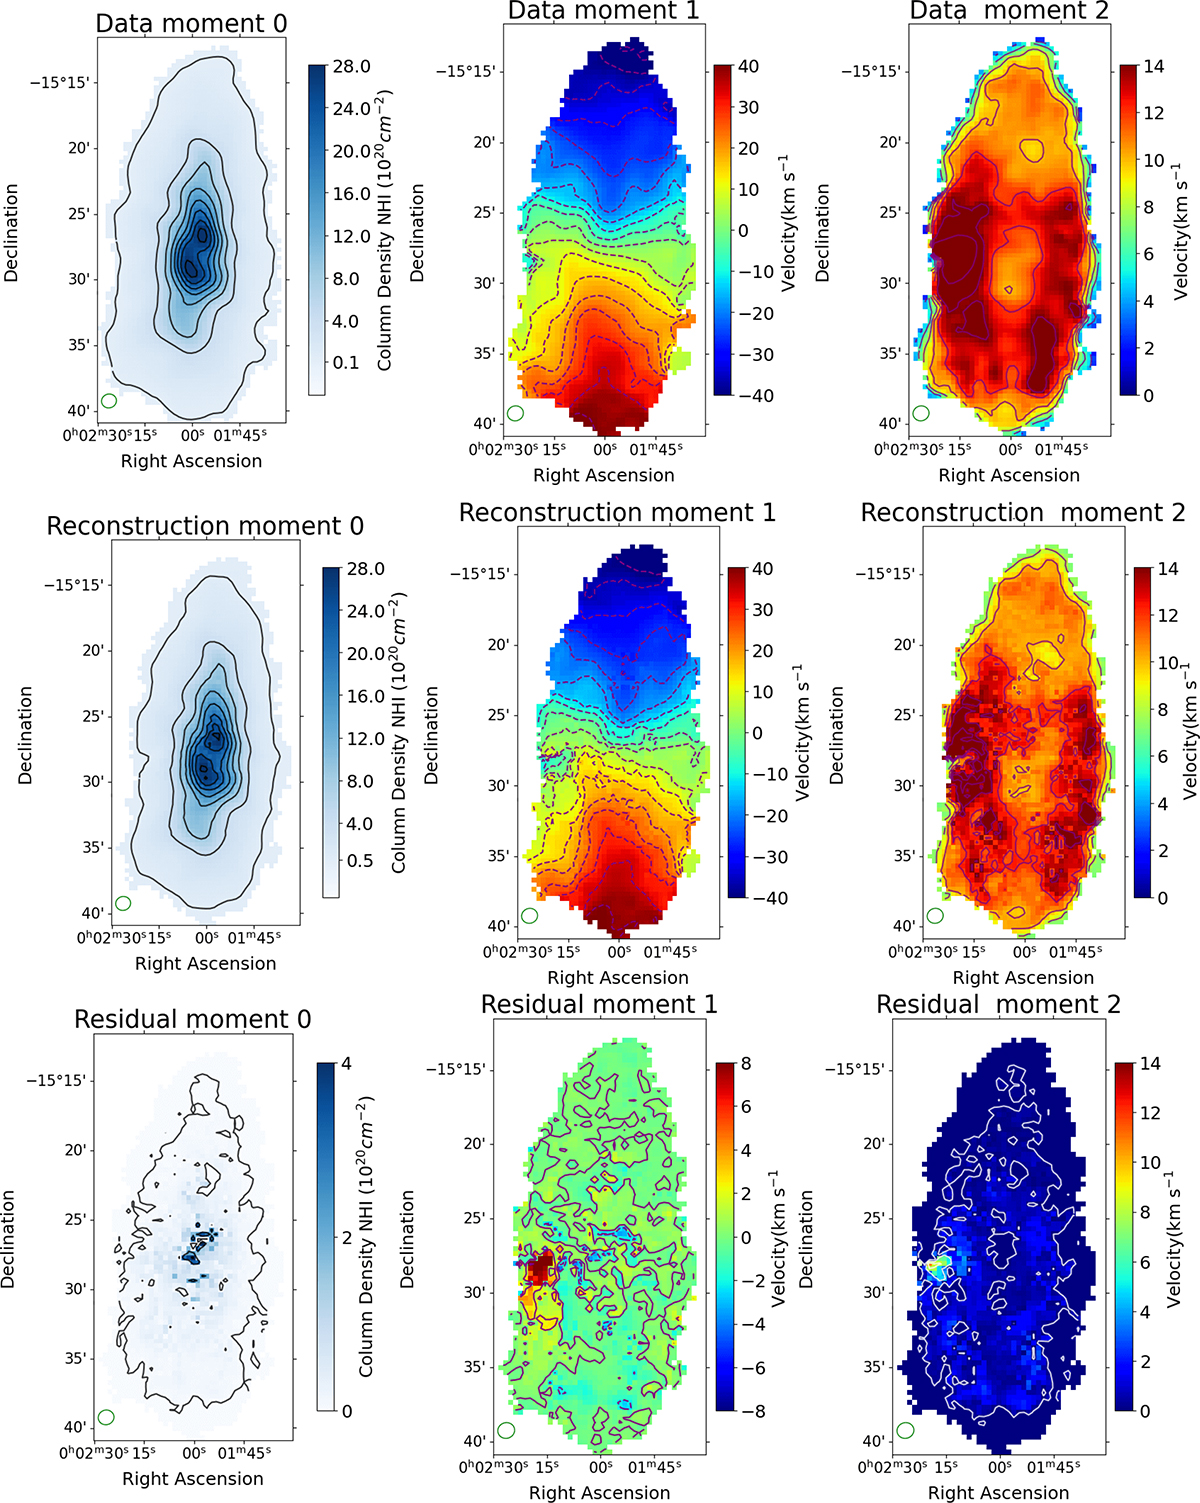
The first row shows moment maps of the Meerkat-64 observations, the second row shows our combined two-component model which reproduces most of the features in the observed moment maps, the bottom row shows the residuals from the subtraction of the two. The contours of moment-0 map correspond to the ticks of the colourbar. The contours on the moment-1 map correspond to a velocity range between −40 and 40 km s−1 with a spacing of 5 km s−1 and for the moment-2 map they correspond to 6,8,10,12 and 14 km s−1, respectively.
Current usage metrics show cumulative count of Article Views (full-text article views including HTML views, PDF and ePub downloads, according to the available data) and Abstracts Views on Vision4Press platform.
Data correspond to usage on the plateform after 2015. The current usage metrics is available 48-96 hours after online publication and is updated daily on week days.
Initial download of the metrics may take a while.