Fig. 9.
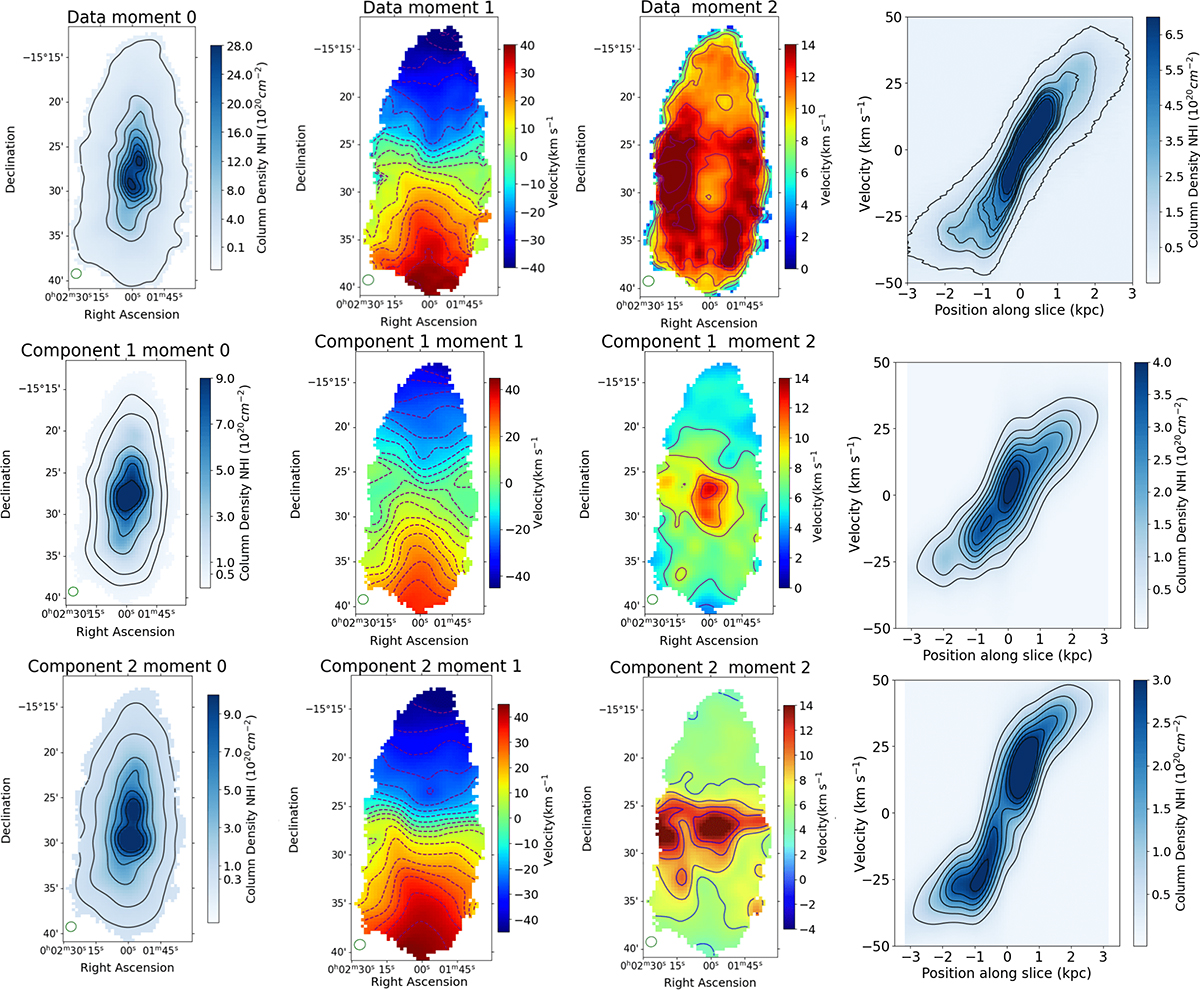
Download original image
First row shows the moment maps from our MeerKAT observations. Second row shows the moment maps of the slower component from our decomposition, which is also the central compact component. Row 3 has maps for the faster component, which is the more extended disc-like component. Each row is presented with a corresponding PV diagram to the right. The contours on the moment-0 map and the PV diagram correspond to the ticks on the colour bar. The contours on the moment-1 map correspond to a velocity range between −40 and 40 km s−1 with a spacing if 5 km s−1 and for the moment-2 map they correspond to 6,9 and 12 km s−1, respectively.
Current usage metrics show cumulative count of Article Views (full-text article views including HTML views, PDF and ePub downloads, according to the available data) and Abstracts Views on Vision4Press platform.
Data correspond to usage on the plateform after 2015. The current usage metrics is available 48-96 hours after online publication and is updated daily on week days.
Initial download of the metrics may take a while.