Fig. B.1.
Download original image
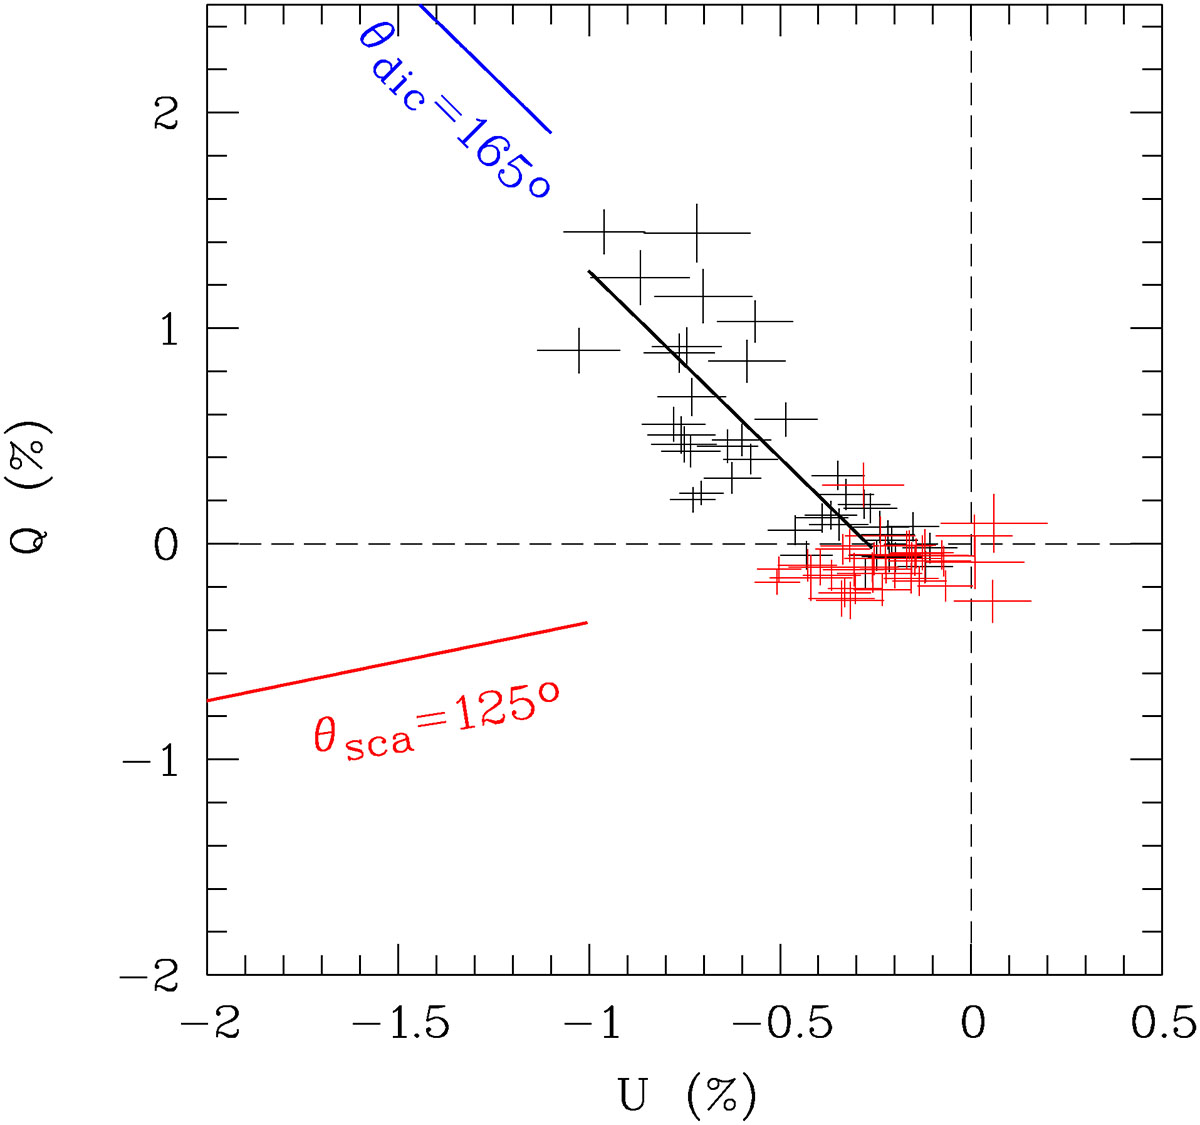
Polarization spectrum of NGC 1365N, binned over 30 spectral pixels (100 Å), plotted in the normalized Stokes q, u plane. The black crosses represent the data, with their error bars. The solid black line represents the polarization model fitted to the data. The model is a combination of polarization scattering at θ ≃ 125° and polarization due to dichroic extinction at θ ≃ 165°, the individual components being indicated by the red and blue solid lines, respectively. The red crosses represent the measured q, u parameters corrected for dichroic extinction, with error bars.
Current usage metrics show cumulative count of Article Views (full-text article views including HTML views, PDF and ePub downloads, according to the available data) and Abstracts Views on Vision4Press platform.
Data correspond to usage on the plateform after 2015. The current usage metrics is available 48-96 hours after online publication and is updated daily on week days.
Initial download of the metrics may take a while.