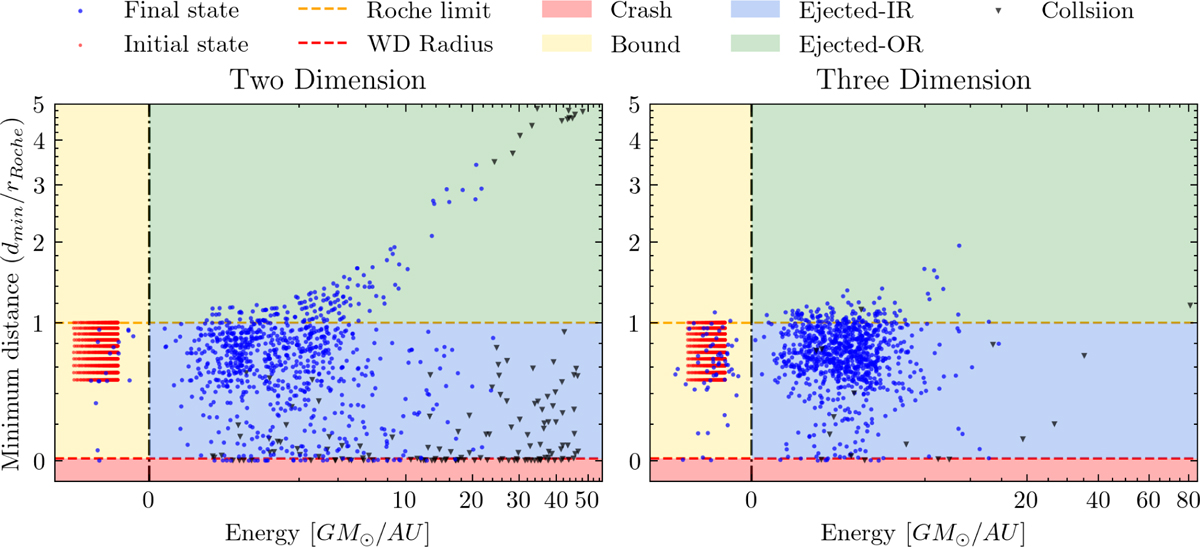
Fig. 3
Download original image
Distribution of the final asteroid energy and minimum distance to the WD during the entire simulation. The system parameters selected for this simulation are the benchmark parameters of WD1856+534b system given in Table 1. The red dots in the figure represent the initial state of asteroids. The black dots represent the final state of each asteroid group at the end of the simulation; the color of the region in which they land denotes their ultimate fate. The inverted black triangles indicate those that collided with planets.
Current usage metrics show cumulative count of Article Views (full-text article views including HTML views, PDF and ePub downloads, according to the available data) and Abstracts Views on Vision4Press platform.
Data correspond to usage on the plateform after 2015. The current usage metrics is available 48-96 hours after online publication and is updated daily on week days.
Initial download of the metrics may take a while.