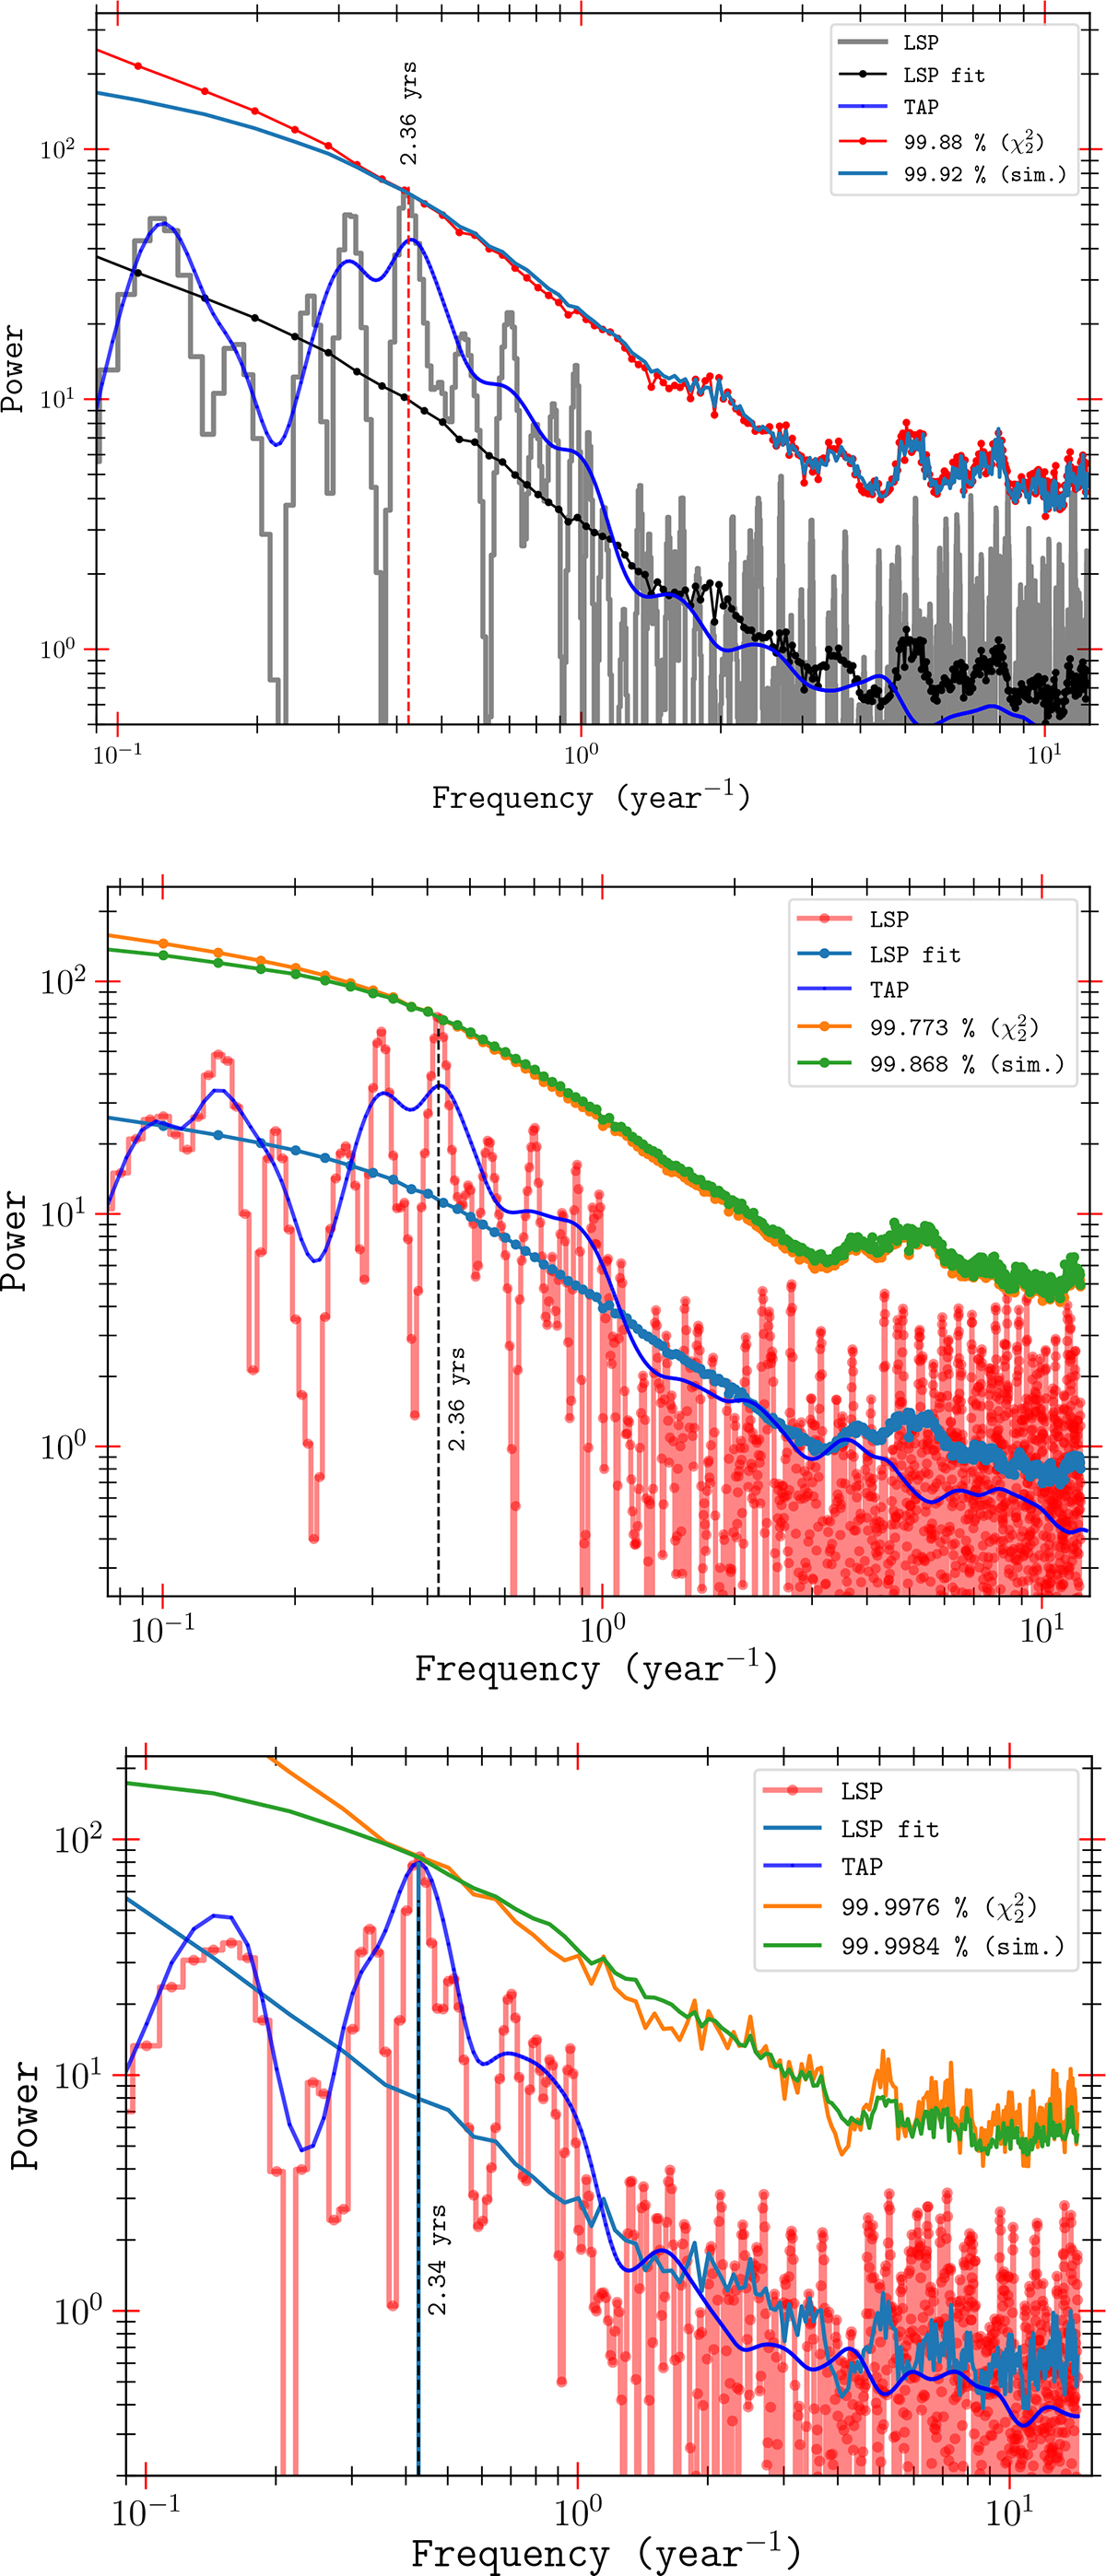
Fig. B.1.
Download original image
Upper panel: LSP of the main segment of the light curve of Ton 599 from 1997 to 2020. The LSP fit is the mean of LSPs from 106 simulated light curves; the 99.88% χ2 significance curve is evaluated following Vaughan (2005) (see corresponding Eq. 16); the 99.92% (sim.) shows the percentile significance evaluated from the distribution of the simulated light curves’ LSP powers. The QPO signal has been found to be at around the noted significance levels. Middle panel: As above, but for the entire set of observations from 1990 to 2020. Lower panel: As above, but for the restricted span 2006 to 2020.
Current usage metrics show cumulative count of Article Views (full-text article views including HTML views, PDF and ePub downloads, according to the available data) and Abstracts Views on Vision4Press platform.
Data correspond to usage on the plateform after 2015. The current usage metrics is available 48-96 hours after online publication and is updated daily on week days.
Initial download of the metrics may take a while.