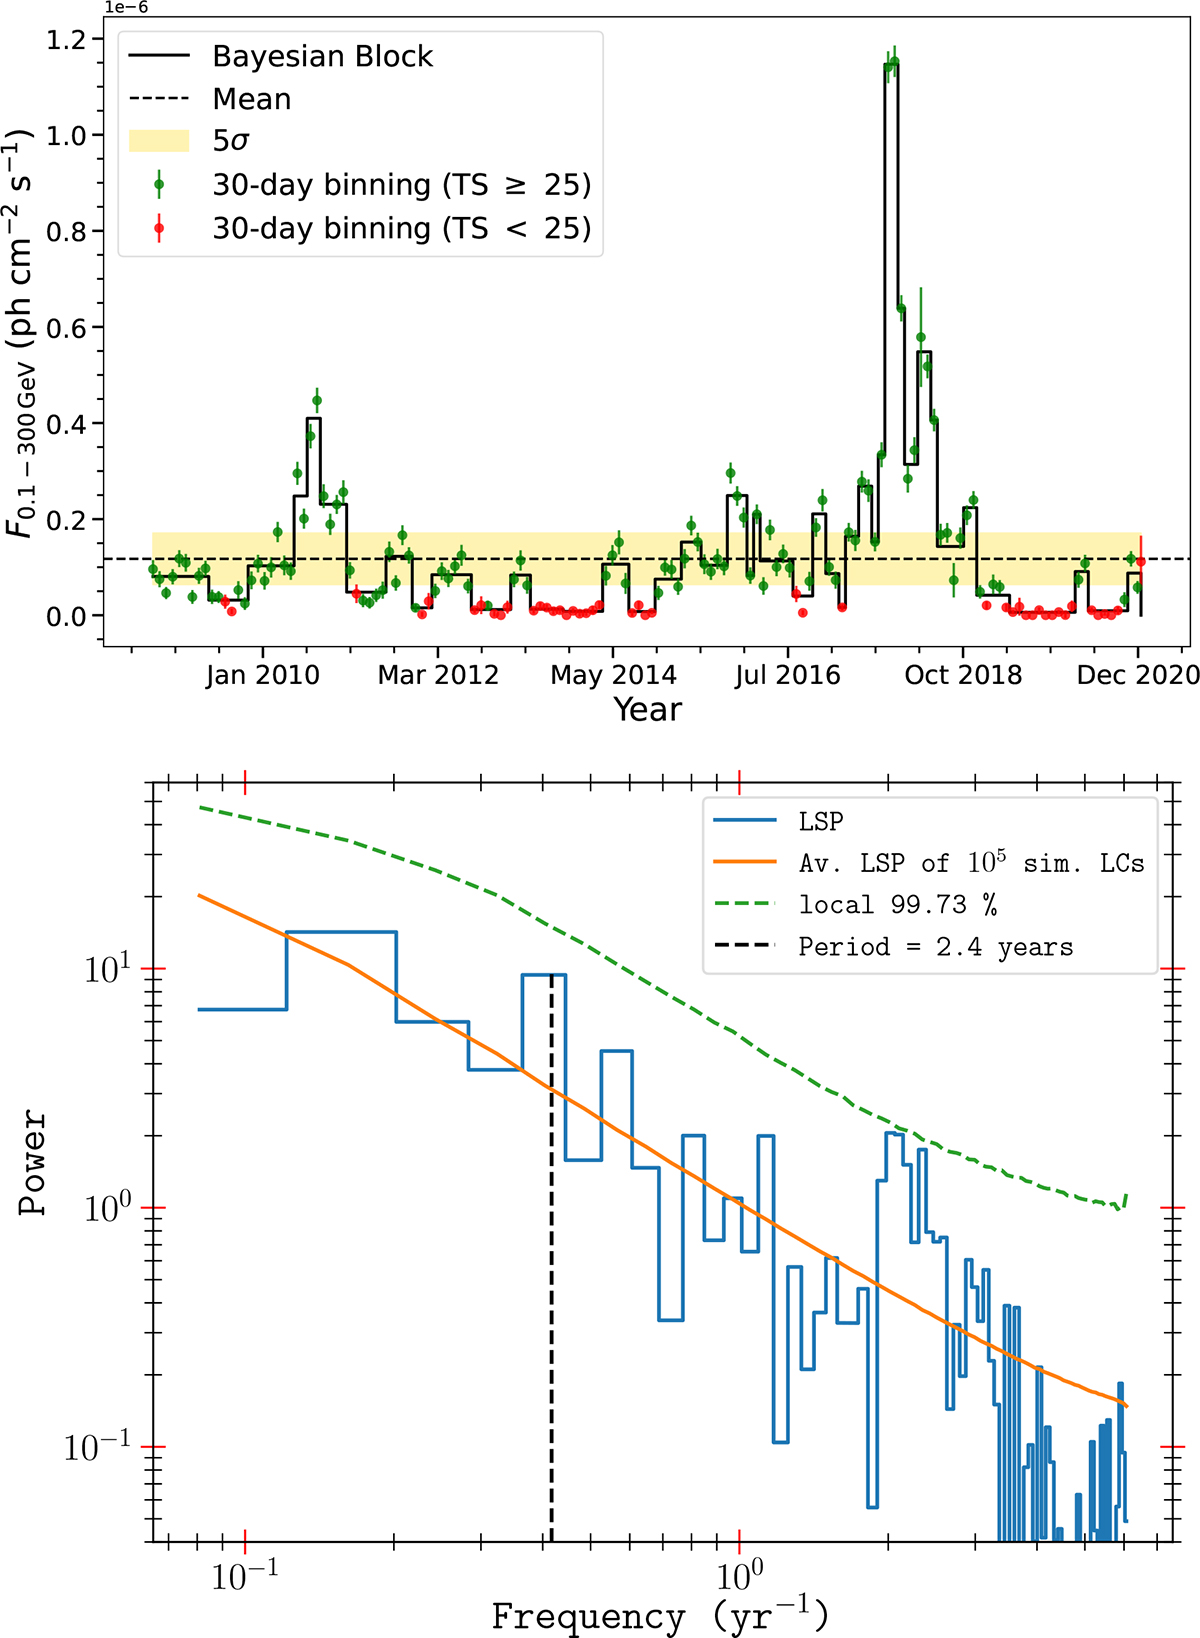
Fig. D.2.
Download original image
Upper panel: γ-ray light curve using a Bayesian Block method to detect enhanced γ-ray states with flares. In the label, TS denotes the test statistic, measuring how significantly a source is detected in a given time bin from the likelihood analysis. A value above 25 indicates a solid detection. Lower panel: LSP evaluation along with its significance estimation.
Current usage metrics show cumulative count of Article Views (full-text article views including HTML views, PDF and ePub downloads, according to the available data) and Abstracts Views on Vision4Press platform.
Data correspond to usage on the plateform after 2015. The current usage metrics is available 48-96 hours after online publication and is updated daily on week days.
Initial download of the metrics may take a while.