Fig. 3
Download original image
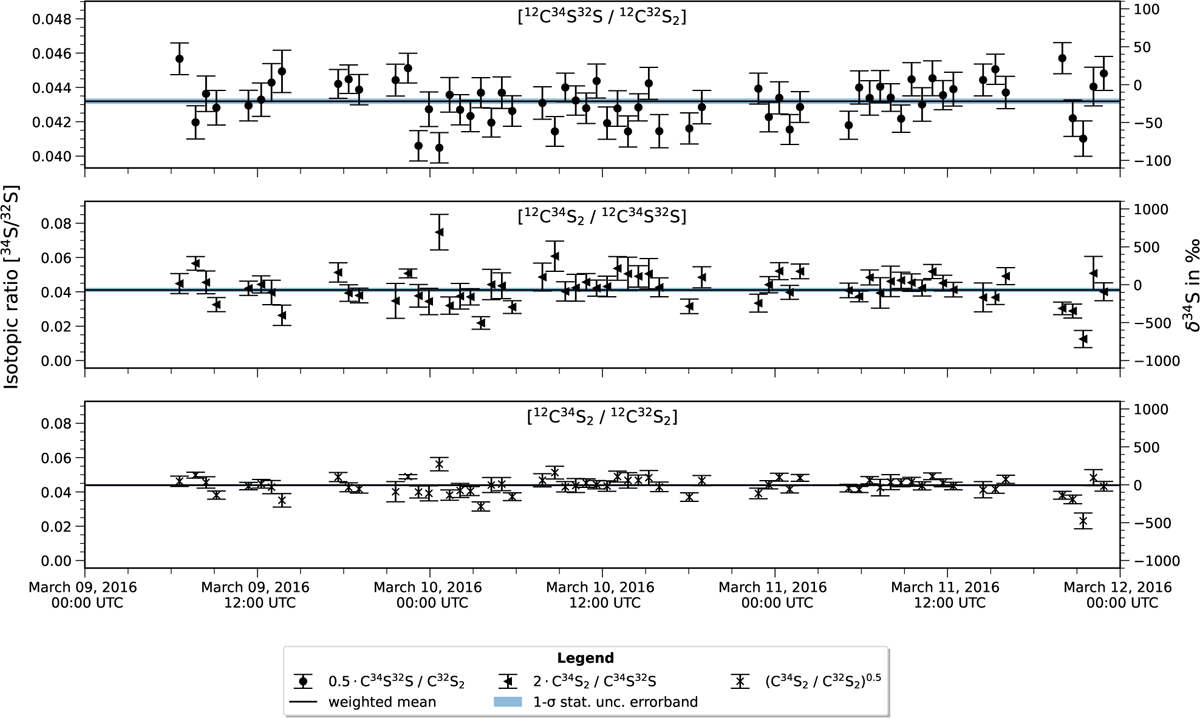
Isotopic ratios of the individual spectra. On the left axis, the unitless 34S/32S ratio is shown, and the right axis represents the corresponding deviation from the V-CDT standard in per mille. Note that the y-axis in the top panel is compressed to one-tenth of the scale used in the remaining panels. The solid line and shaded region represent the weighted mean and its corresponding 1σ statistical error band. The uncertainties of the individual data points shown here only include statistical uncertainties.
Current usage metrics show cumulative count of Article Views (full-text article views including HTML views, PDF and ePub downloads, according to the available data) and Abstracts Views on Vision4Press platform.
Data correspond to usage on the plateform after 2015. The current usage metrics is available 48-96 hours after online publication and is updated daily on week days.
Initial download of the metrics may take a while.