Open Access
Fig. 6
Download original image
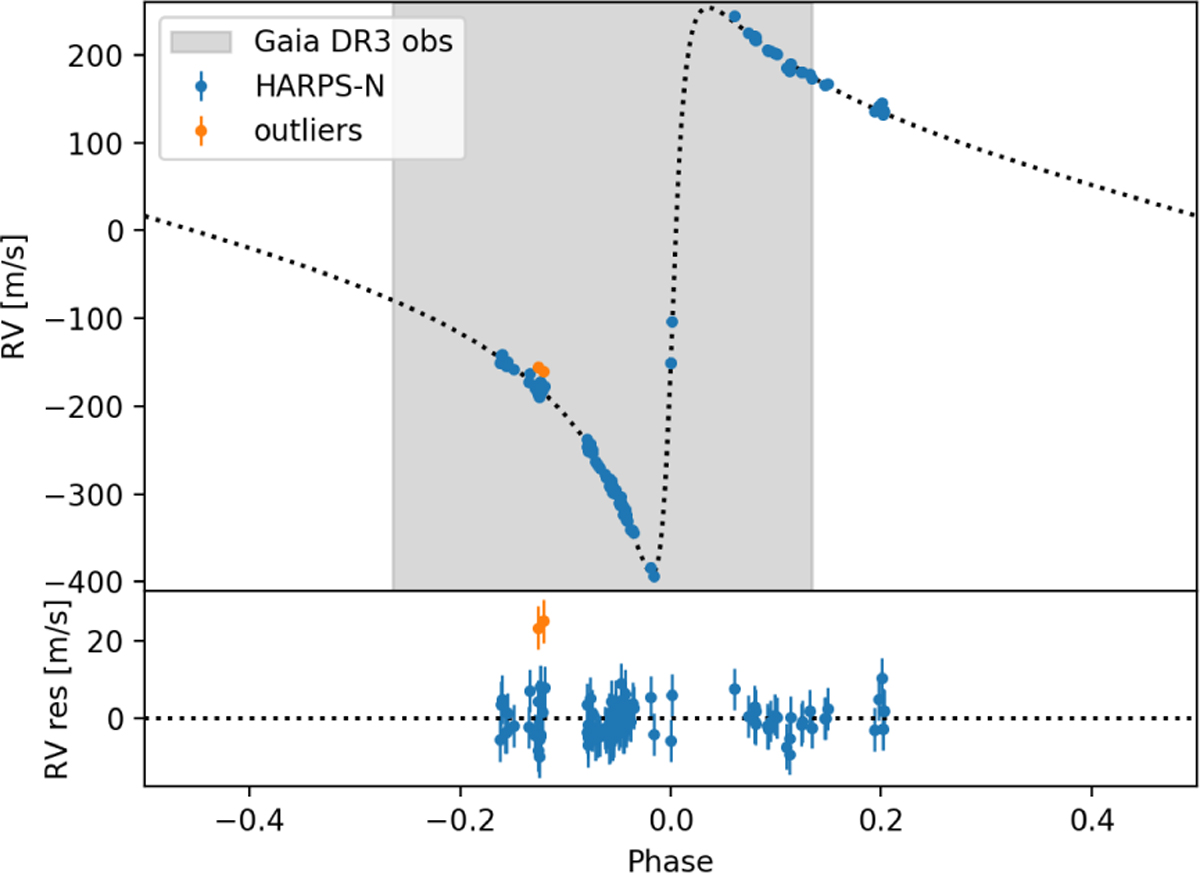
Phase-folded best-fit RV one-Keplerian model, corrected for the instrumental offset (top panel) and the RV residuals (bottom panel). The orange dots represents the outliers discussed in Sect. 4.2, while the grey- shaded area represent the phase coverage of Gaia DR3 observations.
Current usage metrics show cumulative count of Article Views (full-text article views including HTML views, PDF and ePub downloads, according to the available data) and Abstracts Views on Vision4Press platform.
Data correspond to usage on the plateform after 2015. The current usage metrics is available 48-96 hours after online publication and is updated daily on week days.
Initial download of the metrics may take a while.